Time Scale for trend plot x-Axis
Use this feature to specify the time scale used to plot tumor results on the x-axis of the trend plot (also known as spider plot) of the summarized tumor results.
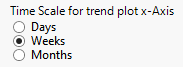
To Specify the Time Scale:
| 8 | Use the radio button to select the desired scale. |