Running this process for the DrosophilaAgingExample sample setting generates one filtered output data set accessed from a Results window shown below. Refer to the Feature Flagger process description for more information about this process.
The Results window contains the following panes:
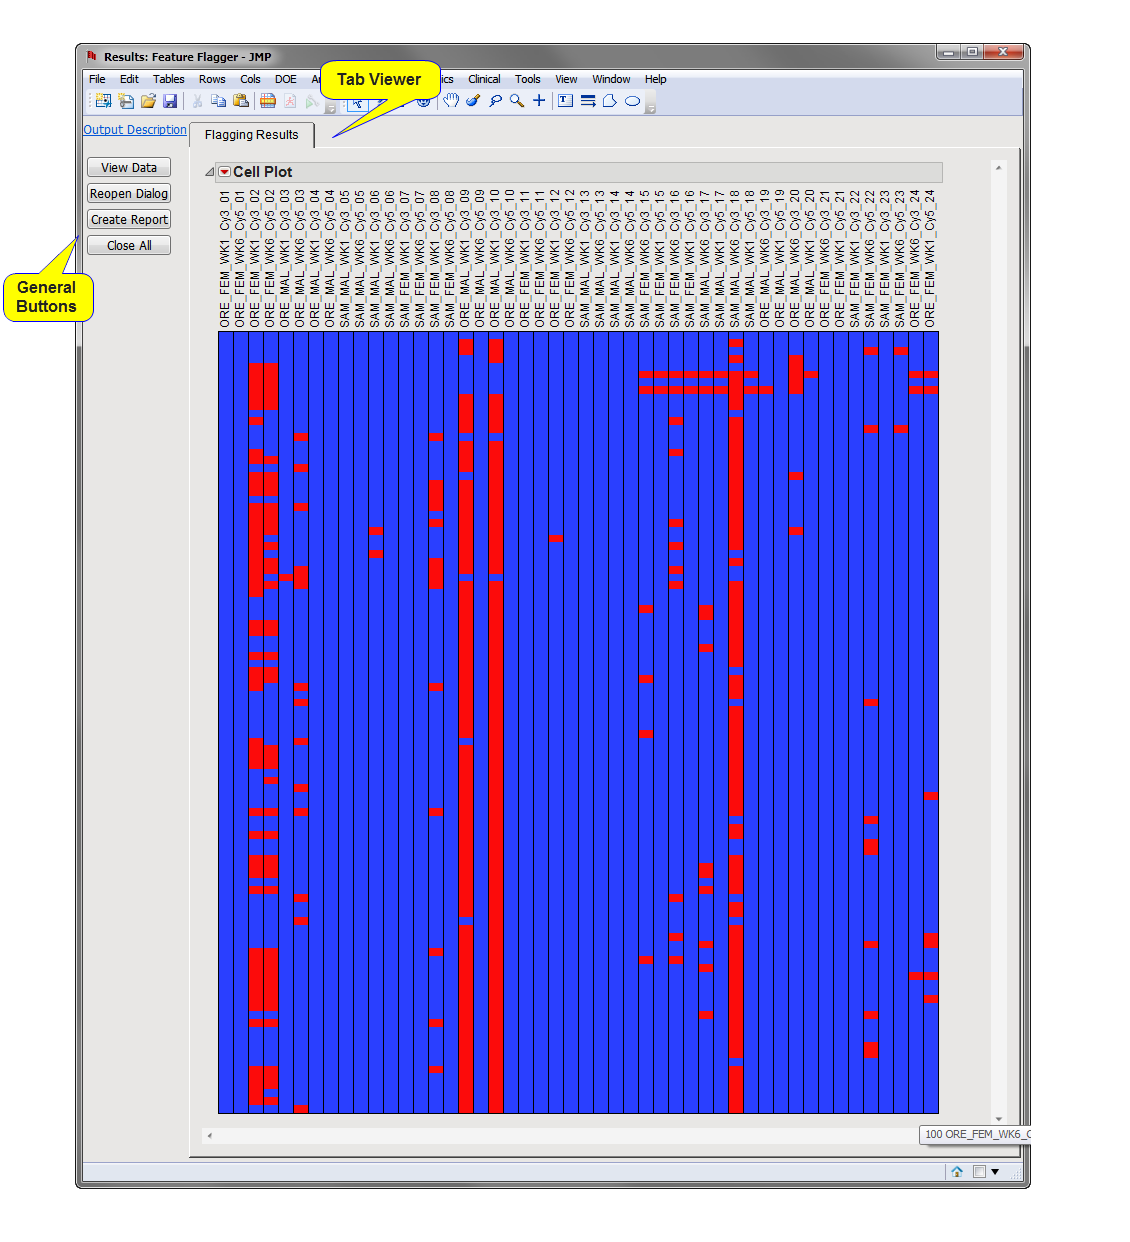
This pane provides you with a space to view individual tabs within the Results window. Use the tabs to access and view the output plots and associated data sets.
|
•
|
Flagging Results: This tab shows the Cell Plot with flagged values highlighted in red.
|
The output data set (identified by the appended _ffi suffix) corresponding to this plot can be accessed by selecting in the Tabs pane. Flagged values are represented by 1s and non-flagged values are represented by 0s.
|
•
|
Click to surface the data sets corresponding to the active tab.
|
|
•
|
Click to reopen the completed process dialog used to generate this output.
|
|
•
|
Click Create Report to generate a pdf- or rtf-formatted report containing the plots and charts of selected tabs.
|
|
•
|
Click to close all graphics windows and underlying data sets associated with the output.
|
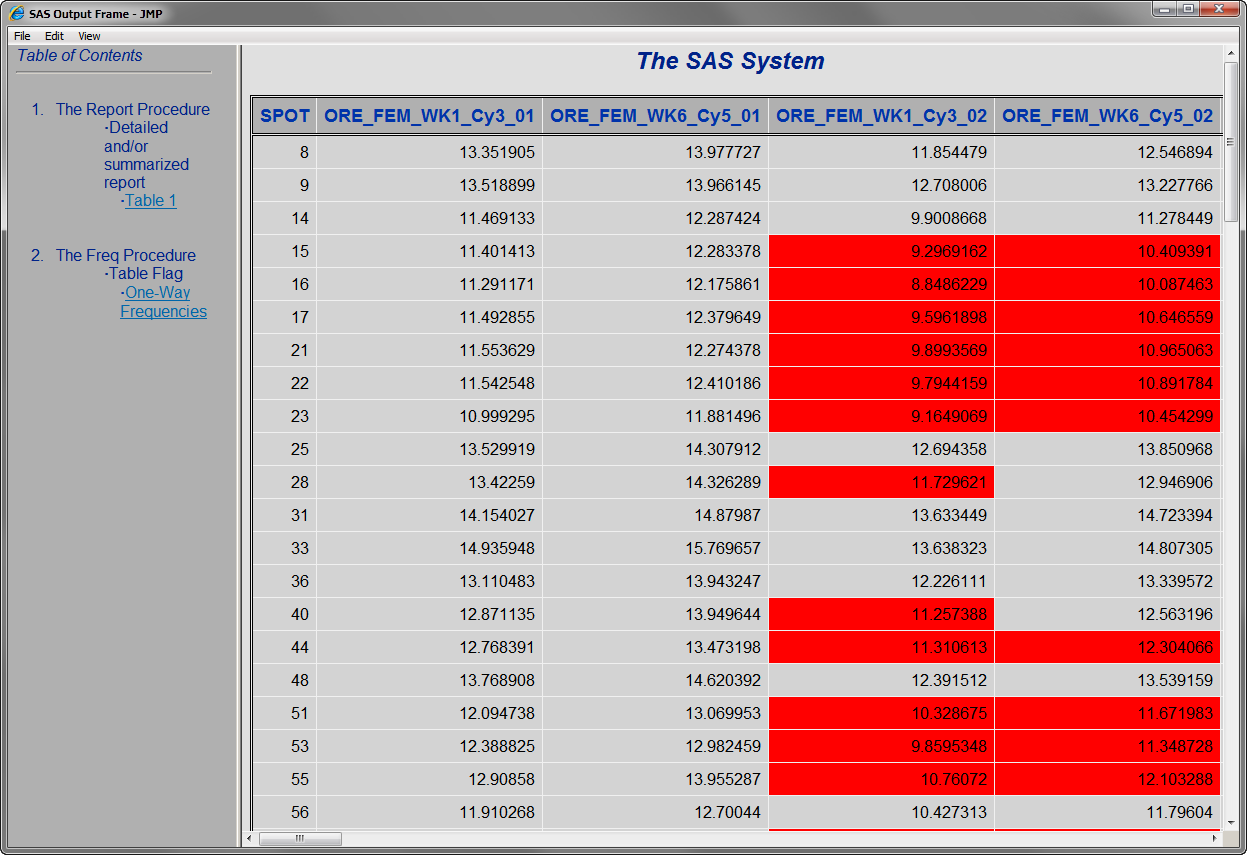
In addition, a SAS Output Frame containing two .html tables is generated. The first table lists those rows containing a flagged value. Flagged values are highlighted in red. The second table (not shown) contains the SAS PROC FREQ results.