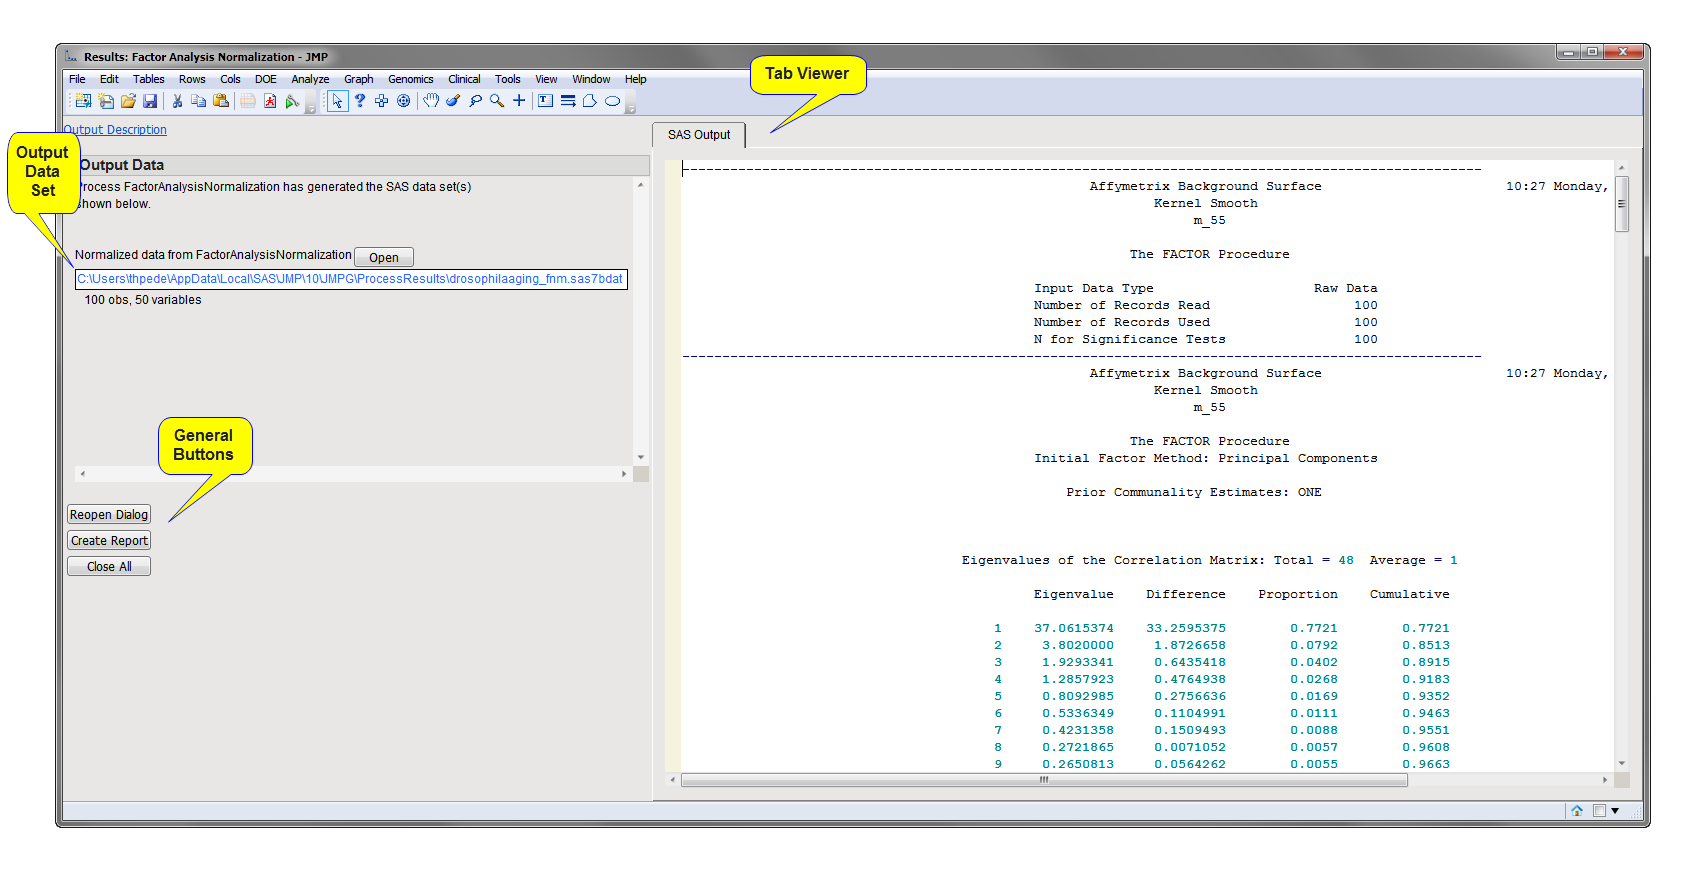
Running this process for the DrosophilaAgingExample sample setting generates the tabbed Results window shown below. Refer to the Factor Analysis Normalization process description for more information. Output from the process is organized into tabs. Each tab contains one or more plots, data panels, data filters, and so on, that facilitate your analysis.
The Results window contains the following panes:
This pane provides you with a space to view individual tabs within the Results window. Use the tabs to access and view the output plots and associated data sets.
|
•
|
SAS Output: This is a text-based output directly from SAS/STAT PROC FACTOR. Refer to the documentation for SAS PROC FACTOR for more information.
|
|
•
|
Output Normalized Data Set: This data set (identified by the appended _fnm suffix) contains the factor analysis normalized data. This data set can be used as input for a wide variety of analytical processes.
|
Note: You should visually evaluate the results of this process using the Distribution Analysis process before using the normalized data in subsequent analyses. See Evaluation of Normalization Methods for a comparison of the different normalization methods with the sample data.
|
•
|
Click to reopen the completed process dialog used to generate this output.
|
|
•
|
Click Create Report to generate a pdf- or rtf-formatted report containing the plots and charts of selected tabs.
|
|
•
|
Click to close all graphics windows and underlying data sets associated with the output.
|