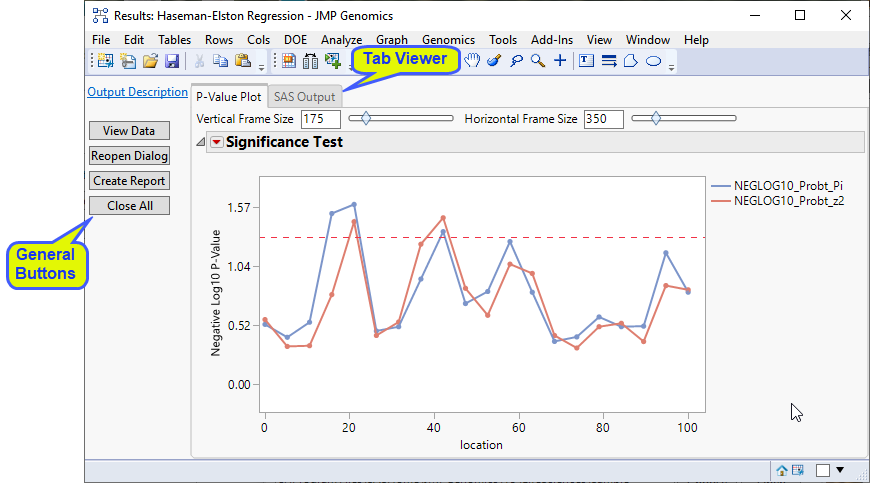
Running this process using the Merlin_asp sample setting generates the tabbed Results window shown below. Refer to the Haseman Elston Regression process description for more information. Output from the process is organized into tabs. Each tab contains one or more plots, data panels, data filters, and so on. that facilitate your analysis.
This pane provides you with a space to view individual tabs within the Results window. Use the tabs to access and view the output plots and associated data sets.
|
•
|
All P-Value Plots: When there are multiple annotation groups (chromosomes or genes, for example), the All P-Value Plots tab shows all the p-value plots from the Annotation Group Results tabs in a single display.
|
Note: When an annotation group variable is not specified, as in this example, or there is only one annotation group, the tab is named P-Value Plot and contains an overlay plot of p-value by chromosome location for all markers.
|
•
|
Annotation Group Results: When there are multiple annotation groups (chromosomes or genes, for example), a separate Results tab with an overlay plot of p-value by chromosome location is created for each annotation group. In this example, there are no annotation groups specified.
|
|
•
|
SAS Output: This tab displays the SAS output from PROC MIXED for fitting the Haseman-Elston regression. This output includes estimates of the pi and z fixed effects.
|
|
•
|
Click to reveal the underlying data table associated with the current tab.
|
|
•
|
Click to reopen the completed process dialog used to generate this output.
|
|
•
|
|
•
|
Click to close all graphics windows and underlying data sets associated with the output.
|