Running this process for the qtlbc_recombinations_lmo_sample setting generates the tabbed Results window shown below. Refer to the Linkage Map Viewer process description for more information. Output from the process is organized into tabs. Each tab contains one or more plots, data panels, data filters, and so on, that facilitate your analysis.
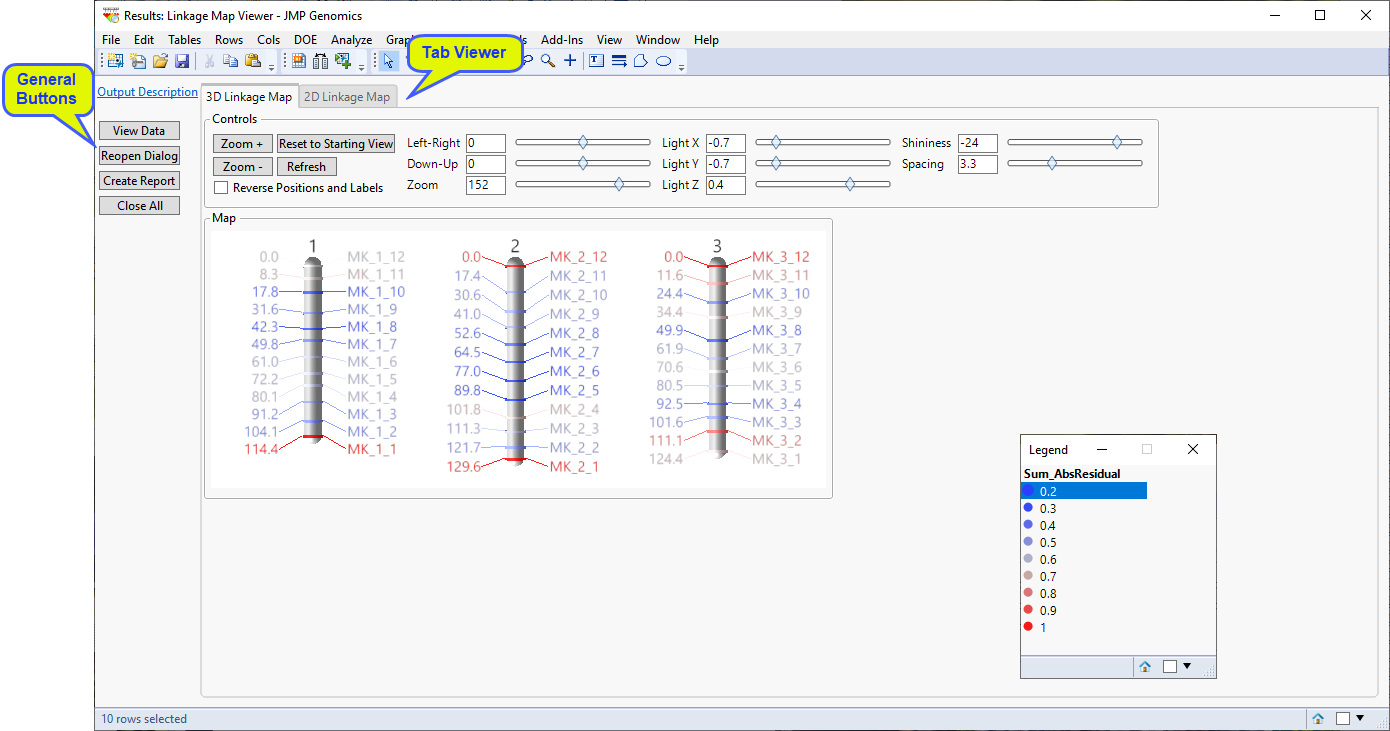
This pane provides you with a space to view individual tabs within the Results window. Use the tabs to access and view the output plots and associated data sets.
|
•
|
3D Linkage Map: This tab displays a three-dimensional linkage map.
|
|
•
|
2D Linkage Map: This tab displays a two-dimensional linkage map.
|
|
•
|
Click to reveal the underlying data table associated with the current tab.
|
|
•
|
Click to reopen the completed process dialog used to generate this output.
|
|
•
|
|
•
|
Click to close all graphics windows and underlying data sets associated with the output.
|