Running this process using the GeneticMarkerExample sample setting generates the tabbed Results window shown below. Refer to the Cross Evaluation process description for more information. Output from the process is organized into tabs. Each tab contains one or more plots, data panels, data filters, and so on. that facilitate your analysis.
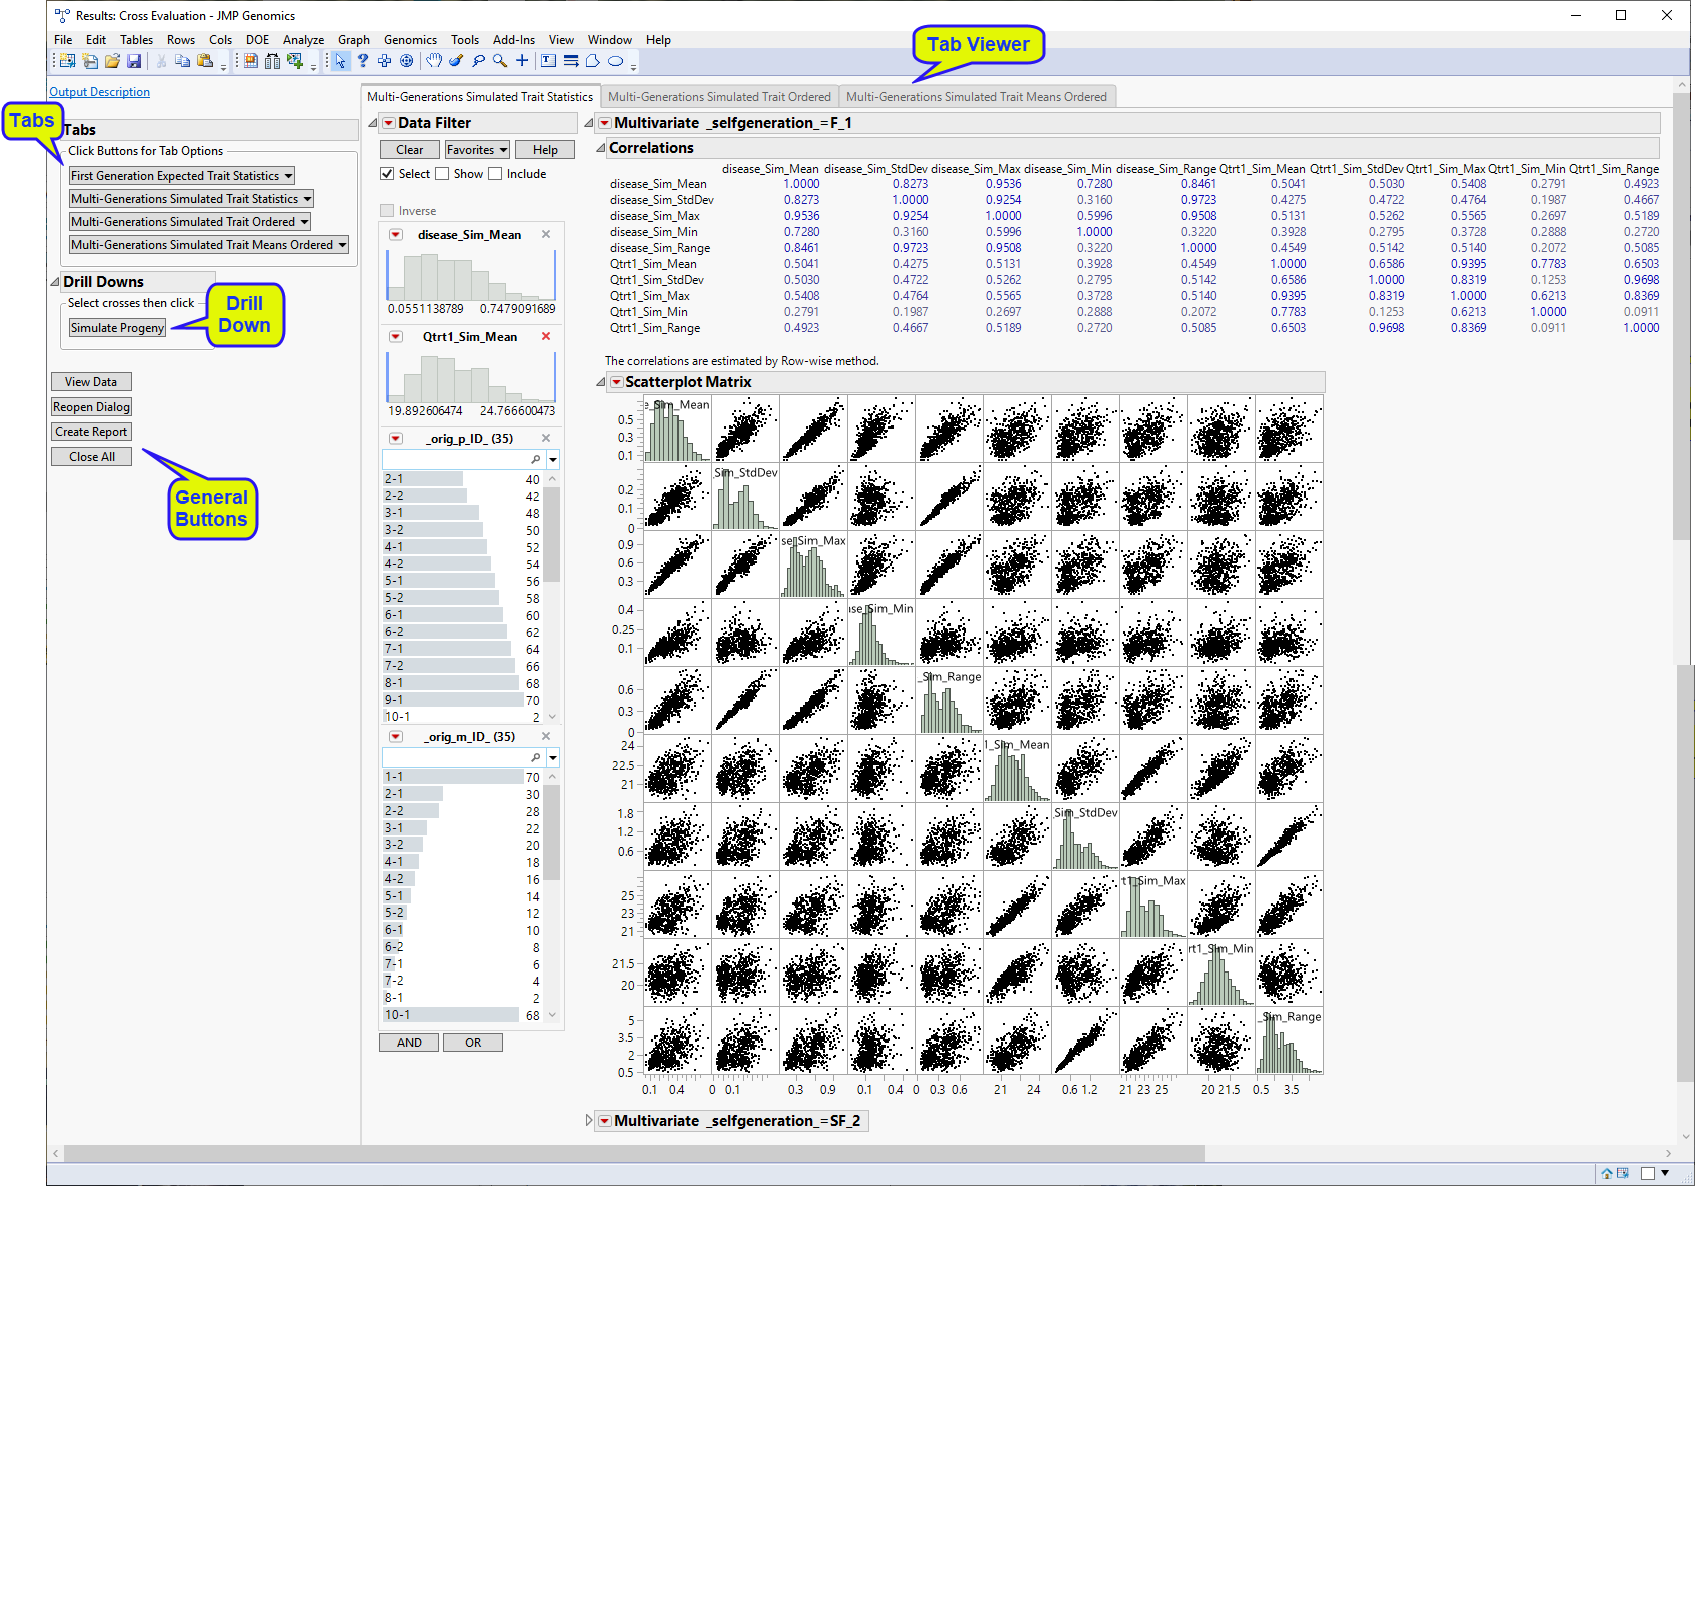
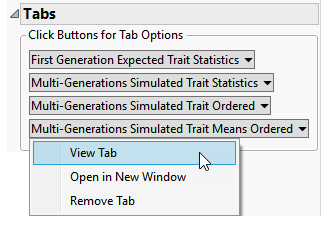
This pane enables you to access and view the output plots and associated data sets on each tab. Use the drop-down menu to view the tab in the Tab Viewer pane, open the tab in a new window, or remove the tab and its contents from the Tab Viewer pane.
|
•
|
First Generation Expected Trait Statistics: This tab shows a scatterplot matrix of the correlation of various statistics for the expected trait values of the first generation of crosses using analytically-derived expectations based on probability distributions of progeny genotypes for each cross.
|
|
•
|
Multi-Generations Simulated Trait Statistics: This tab shows a scatterplot matrix of the correlation of various statistics for the assessed traits among progeny of the crosses for the multi-generations of crosses.
|
Note: This tab is available only when the option to Simulate multiple generations is selected.
|
•
|
Multi-Generations Simulated Trait Ordered: This tab displays graphs of the average modeled traits across simulated progenies for each generation-cross combination in the y-axis, and their respective generation-cross combination in the x-axis. The crosses and generations in the x-axis are ordered in ascending values from left to right according to the modeled trait value.
|
|
•
|
Multi-Generations Simulated Trait Means Ordered: This tab displays graphs of the modeled traits averaged of simulated progenies across multiple generations in the y-axis, and their respective crosses in the x-axis. The crosses in the x-axis are ordered in ascending values from left to right according to the average of modeled trait.
|
|
•
|
Simulated Trait Statistics (Cross Evaluation): This tab shows a scatterplot matrix of the correlation of various statistics for the assessed traits among progeny of the crosses.
|
|
•
|
Simulated Trait Means Ordered (Cross Evaluation): This tab displays graphs of the modeled traits averaged across simulated progenies in the y-axis, and their respective crosses in the x-axis. The crosses in the x-axis are ordered in ascending values from left to right according to the average of modeled trait value.
|
This pane provides you with a space to view individual tabs within the Results window. Use the tabs to access and view the output plots and associated data sets.
|
•
|
: Launches the Progeny Simulation process with the data and specifications from this process preloaded as input.
|
|
•
|
Click to reveal the underlying data table associated with the current tab.
|
|
•
|
Click to reopen the completed process dialog used to generate this output.
|
|
•
|
|
•
|
Click to close all graphics windows and underlying data sets associated with the output.
|