Running this process using the Barley (HA) sample setting generates the tabbed Results window shown below. Refer to the Build Consensus Linkage Map process description for more information. Output from the process is organized into tabs. Each tab contains one or more plots, data panels, data filters, and so on. that facilitate your analysis.
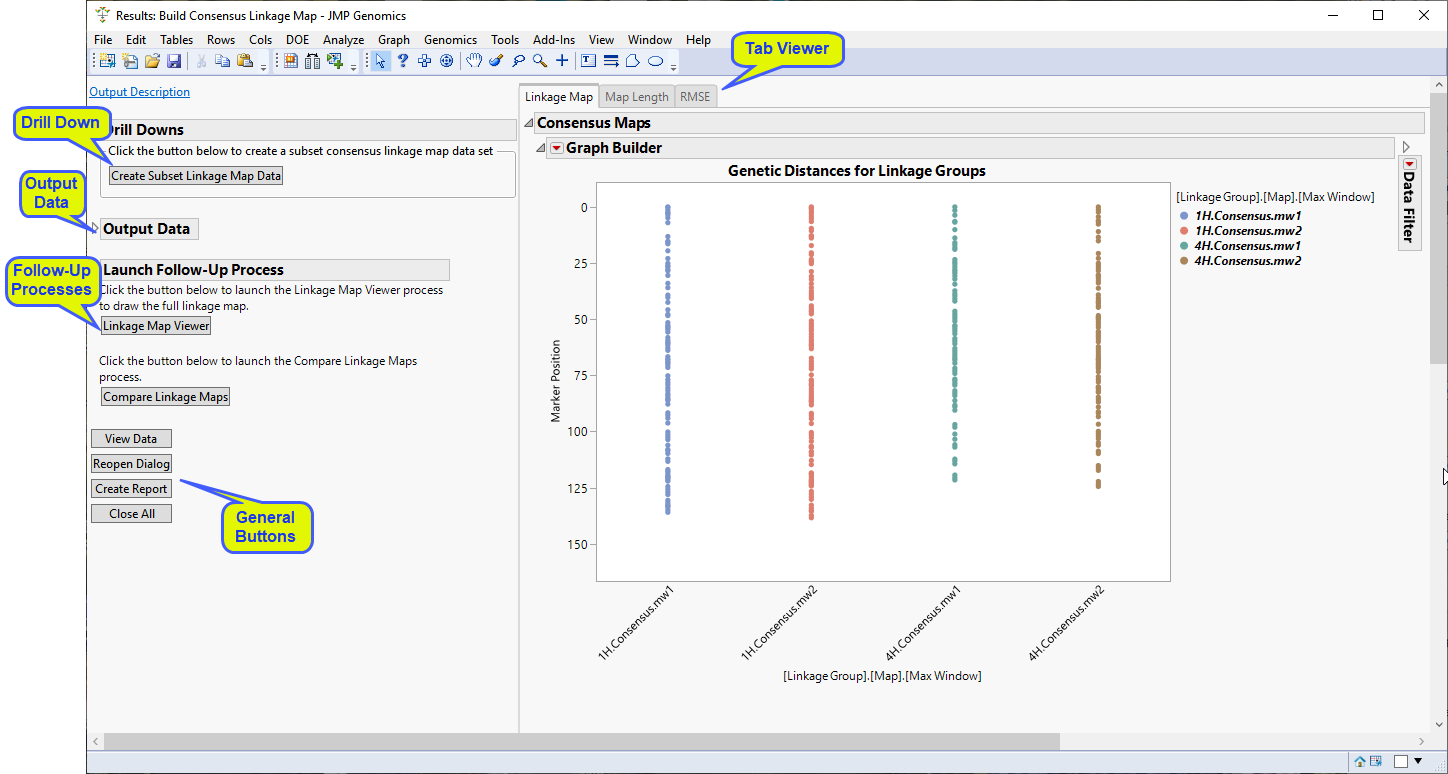
This pane provides you with a space to view individual tabs within the Results window. Use the tabs to access and view the output plots and associated data sets.
|
•
|
Linkage Map: This tab includes a plot that displays the position of markers on the y-axis and the chromosome indexes on the x-axis.
|
|
•
|
Map Length: This tab includes plots for each chromosome displaying the map length on the y-axis and the chromosome indexes on the x-axis.
|
|
•
|
RMSE (Build Consensus Linkage Map): This tab includes plots for each chromosome displaying the root mean square error (RMSE) on the y-axis and the maximum interval window on the x-axis.
|
|
•
|
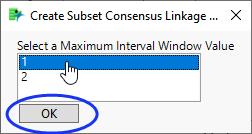
Create Subset Linkage Map Data: Click this drill-down to subset the consensus linkage map data for a specified maximum interval window.
|
This option allows you to select a specific consensus linkage map for use in the QTL Mapping related APs (QTL Single Marker Analysis, Build QTL Genotype Probability Data Set, and QTL IM, CIM and MIM Analysis). You must first build a series of consensus maps using different maximum interval windows and determine which interval generates a map with the best fit (for instance, smaller RMSE and/or length). Once you decide on which consensus map to choose, you can use this option to separate the selected map from the others .
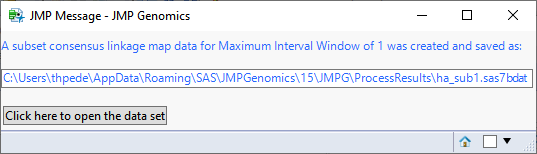
When you click . the output consensus map data set is subsetted to include the consensus map for the specified maximum interval window. The name and location of this subset data set is listed in a JMP Message window, as shown below:
|
•
|
Output Consensus Map Data Set: This tall data set (with suffix _cdl) contains the consensus map and input map data stacked on top of each other. To view this data set, select the Linkage Map tab and click .
|
|
•
|
Output Map Length Data Set: This data set (with suffix _cml), which contains the starting and ending positions and lengths of each of the input linkage groups is used to generate the box plots on the Map Length tab. To view this data set, select the Map Length tab and click .
|
|
•
|
Output RMSE Data Set: This data set (with suffix _crm) contains the root mean square error values that are used to generate the plots on the RMSE tab. To view this data set, select the RMSE tab and click .
|
|
•
|
Consensus Map Data Set (wide format): This data set contains an estimated consensus map for each level of maximum interval window as well as all input linkage maps, displayed side-by-side on distinct columns (wide format). This data set has the same content as displayed in the output tall data set and is included because it allows for an alternative, side-by-side display of the mapping data for each of the maps. Click to view the data set. Alternatively, if the data set is very large, you may need to click to view a small subset of the data.
|
|
•
|
Summary Statistics Data Set: This data set contains columns displaying values of mean and standard deviation (SD) of the root mean square error across input linkage maps, as well as a column of map lengths for the consensus map, for each level of the two factors (window size and chromosome). Click to view the data set. Alternatively, if the data set is very large, you may need to click to view a small subset of the data.
|
|
•
|
Deleted Constraints Data Set: This data set all of the constraints imposed on the order of markers that were deleted from the analysis. Inclusion of these constraints would have rendered the system of equations impossible to solve. Note: This data set is not referenced on the Results window if all constraints were feasible. Click to view the data. Alternatively, if the data set is very large, you might need to click to view a small subset of the data.
|
For detailed information about the files and data sets used or created by JMP Life Sciences software, see Files and Data Sets.
|
•
|
Linkage Map Viewer: Click to launch the Linkage Map Viewer process with the ha_cdl.sas7bdat output consensus map data set preloaded as input.
|
|
•
|
Compare Linkage Maps: Select at least one marker from each of the two linkage maps and click to compare the linkage maps for the selected markers. Two new SAS data sets, the ha_cma.sas7bdat and ha_cmb.sas7bdat data sets, one for each map, are created when you click this drill-down. The the ha_cma.sas7bdat and ha_cmb.sas7bdat data sets contain the map identifier, and selected marker IDs and positions. The Compare Linkage Maps process opens with the two data sets preloaded as input.
|
|
•
|
Click to reveal the underlying data table associated with the current tab.
|
|
•
|
Click to reopen the completed process dialog used to generate this output.
|
|
•
|
|
•
|
Click to close all graphics windows and underlying data sets associated with the output.
|