The Results window contains the following panes:
This pane provides you with a space to view individual tabs within the Results window. Use the tabs to access and view the output plots and associated data sets.
|
•
|
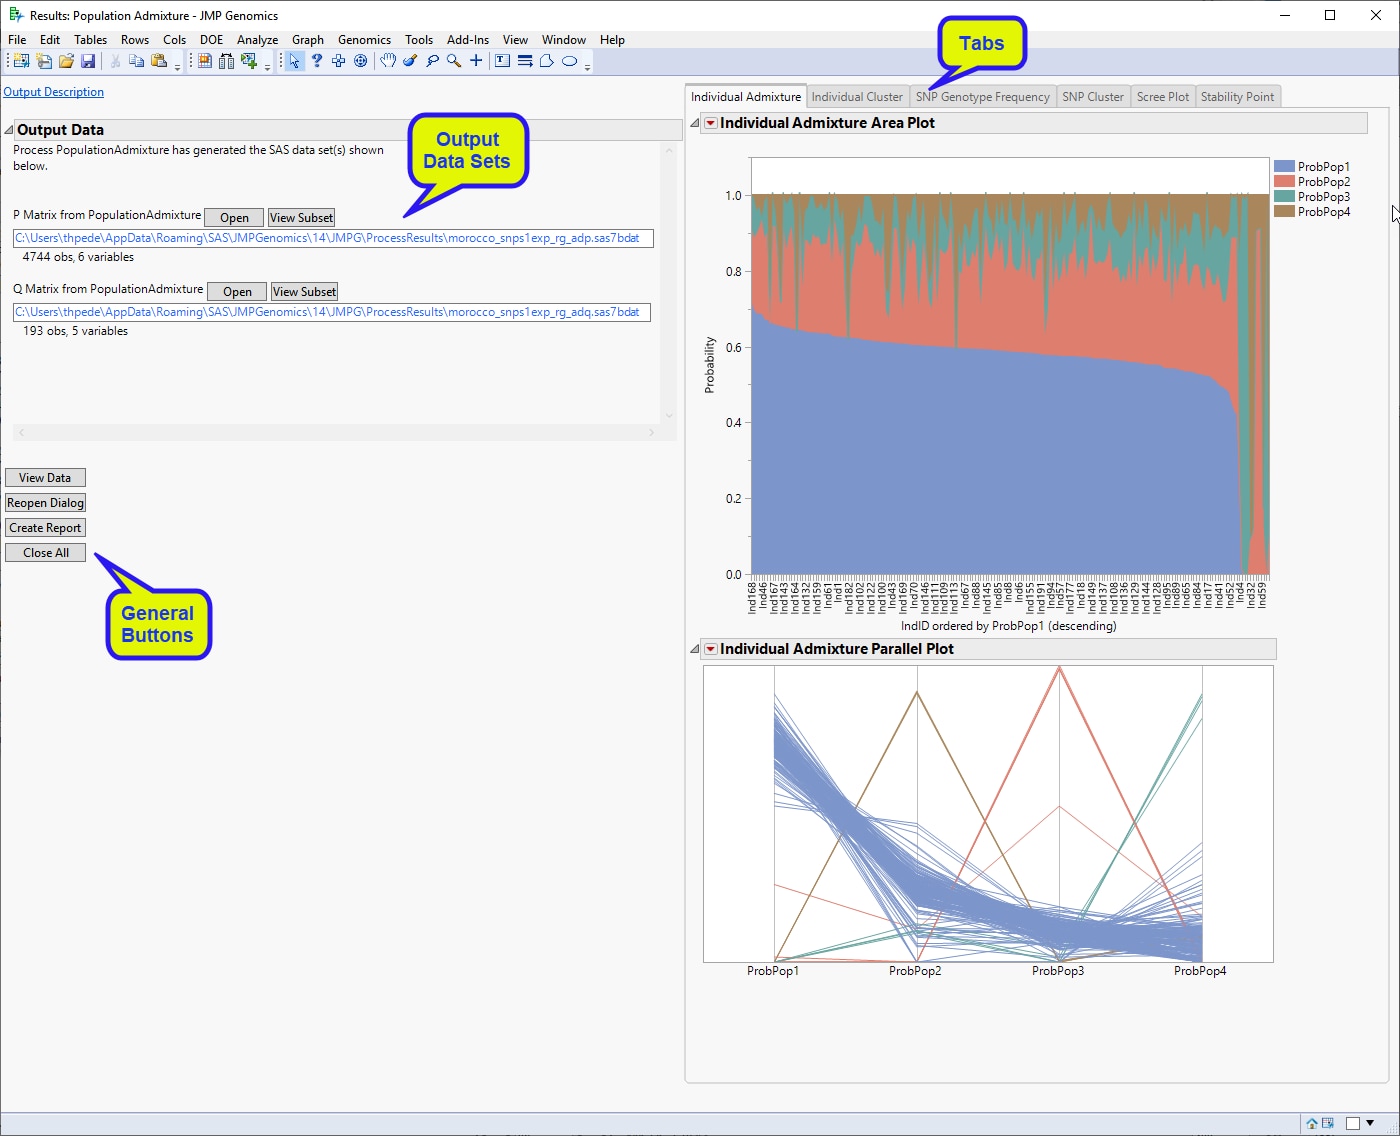
Individual Admixture: This tab displays graphs of the estimated ancestral population admixture probabilities for each individual.
|
|
•
|
Individual Cluster: This tab displays a dendrogram of clusters of individuals based on their ancestral population admixture probabilities.
|
|
•
|
SNP Genotype Frequency: This tab displays a graph of estimated frequency of the reference allele of each marker in each ancestral population.
|
|
•
|
SNP Cluster: This tab displays a dendrogram of clusters of markers based on the frequency of the reference allele of each marker in the ancestral populations.
|
|
•
|
Scree Plot (Population Admixture): This tab displays a graph of eigenvalues in the y-axis and putative number of ancestral populations in the x-axis. This graph can be used to help determining the number of ancestral populations when this parameter is unknown. This graph usually has an elbow shape, and the x-value in the region of the elbow is considered a good estimate for the number of ancestral populations.
|
|
•
|
Stability Point: This tab displays a graph of the estimated number of ancestral populations and their respective estimated variances. This graph can be used to help determining the number of ancestral populations when this parameter is unknown. The second region from the left to right where the variance flats down and finds a minimum is considered a good estimate for the number of ancestral populations.
|
P Matrix from Population Admixture: This data set contains markers in the rows and estimated frequency of reference allele for each marker in each ancestral population in the columns.
Q Matrix from Population Admixture: This data set contains individuals in the rows and estimated admixture probabilities of ancestral populations for each individual in the columns.
For detailed information about the files and data sets used or created by JMP Life Sciences software, see Files and Data Sets.
|
•
|
Click to reveal the underlying data table associated with the current tab.
|
|
•
|
Click to reopen the completed process dialog used to generate this output.
|
|
•
|
|
•
|
Click to close all graphics windows and underlying data sets associated with the output.
|