Running this process for the ProstateCancerExample sample setting generates the tabbed Results window shown below. Refer to the 2D Plot process description for more information. Output from the process is organized into tabs. Each tab contains one or more plots, data panels, data filters, and so on. that facilitate your analysis.
The Results window contains the following panes:
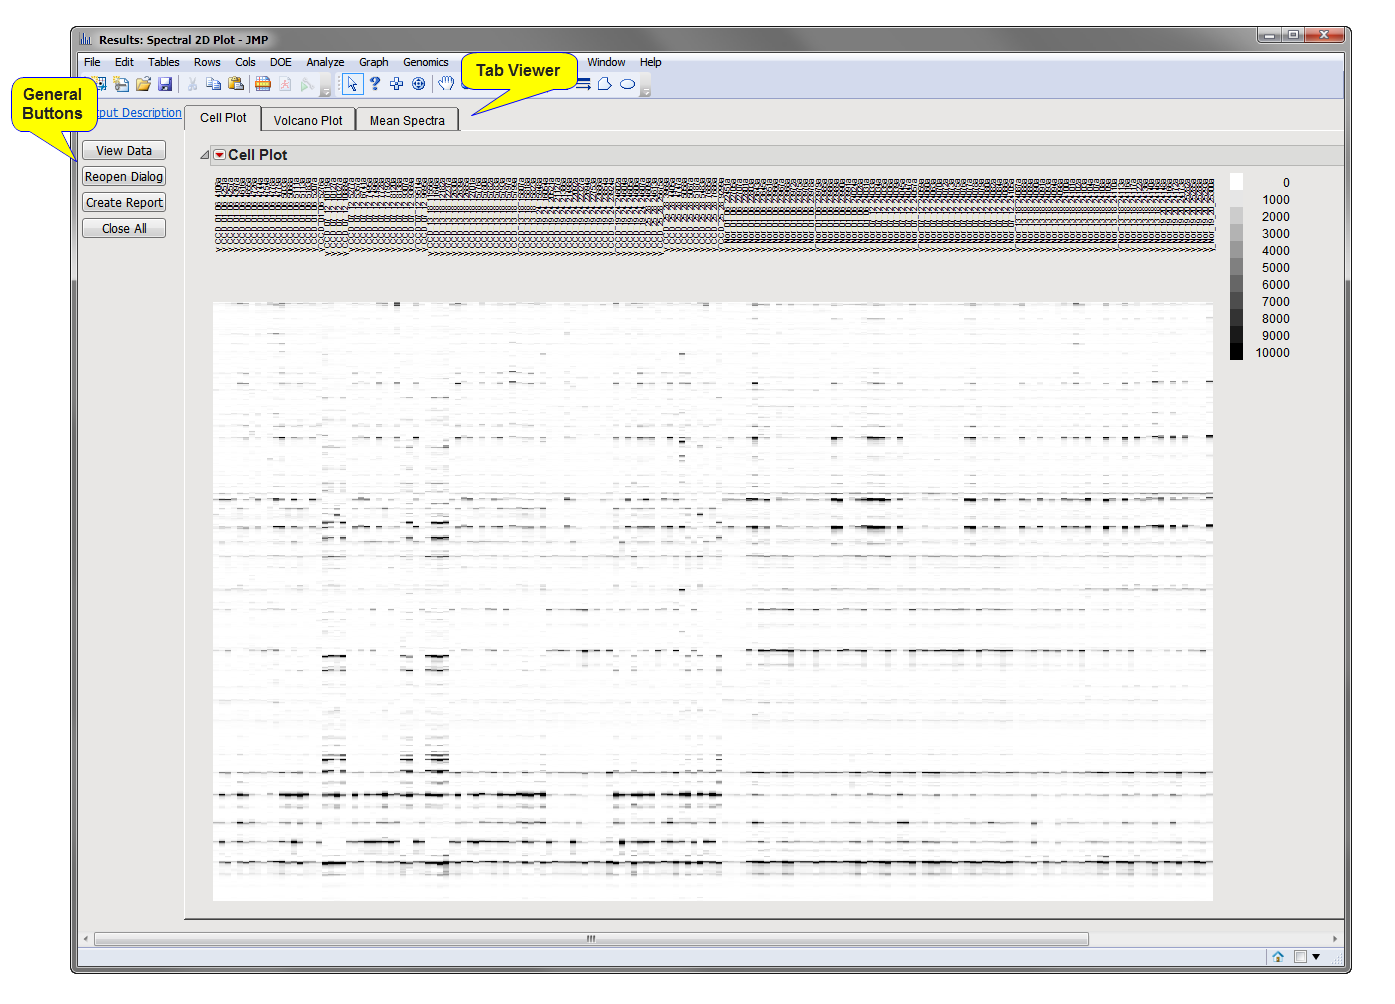
This pane provides you with a space to view individual tabs within the Results window. Use the tabs to access and view the output plots and associated data sets.
|
•
|
Cell Plot: This tab displays each of the individual spectra as a gray-scale heat map.
|
|
•
|
Volcano Plot: This tab displays differences between experimental groups.
|
|
•
|
Mean Spectra: This tab displays an of the mean values of the two groups of spectra plotted against each other.
|
One output data set (identified by the appended _s2g suffix) is generated by this process. It can be accessed by clicking .
|
•
|
Click to reveal the underlying data table associated with the current tab.
|
|
•
|
Click to reopen the completed process dialog used to generate this output.
|
|
•
|
|
•
|
Click to close all graphics windows and underlying data sets associated with the output.
|