Running this process for the Spec_3D_Example sample setting generates the tabbed Results window shown below. Refer to the 3D Plot process description for more information. Output from the process is organized into tabs. Each tab contains one or more plots, data panels, data filters, and so on. that facilitate your analysis.
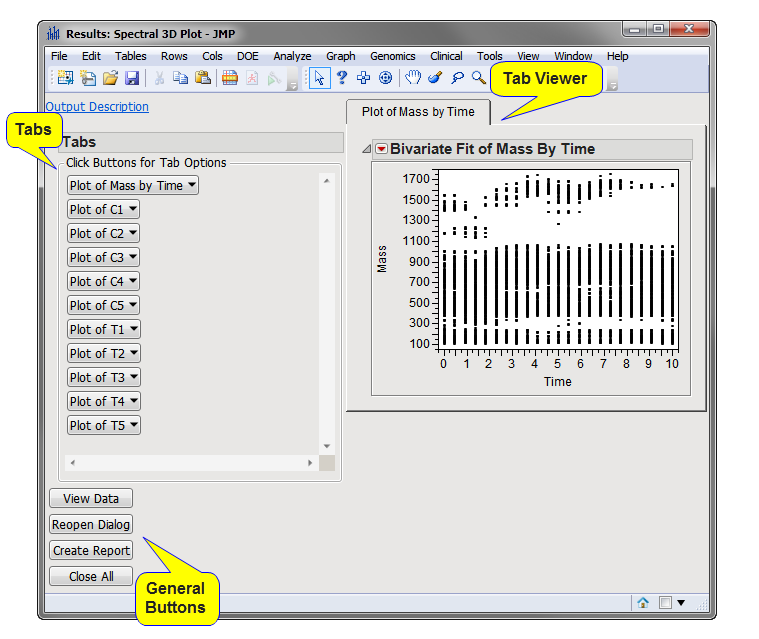
The Results window contains the following panes:
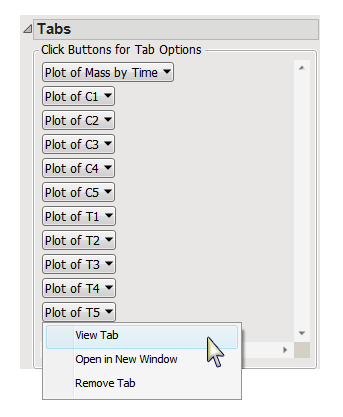
This pane enables you to access and view the output plots and associated data sets on each tab. Use the drop-down menu to view the tab in the Tab Viewer pane, open the tab in a new window, remove the tab and its contents from the Tab Viewer pane, or open the output data set(s) used to generate the plots and charts illustrated on the tab.
|
•
|
Plot of Mass by Time: This tab displays a bivariate fit plot plotting the x and y values (mass versus time, in this example) for each observation.
|
|
•
|
Plot of ...: There is one tab containing a three-dimensional Surface Plot for each of the variables listed in the Z Variables field. Note: For this example, the output includes a total of ten different surface plots.
|
One output data set (identified by the appended _s3g suffix) is generated by this process. It can be accessed by clicking .
|
•
|
Click to reveal the underlying data table associated with the current tab.
|
|
•
|
Click to reopen the completed process dialog used to generate this output.
|
|
•
|
|
•
|
Click to close all graphics windows and underlying data sets associated with the output.
|