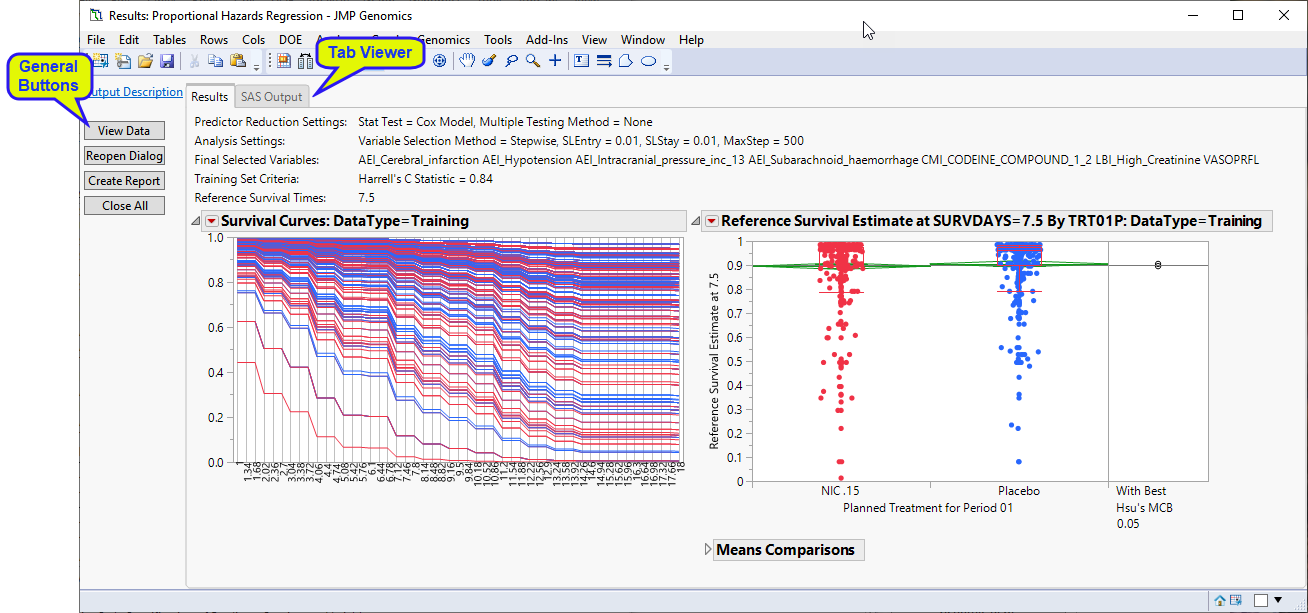
Running this process using the Nicardipine sample setting generates the tabbed Results window shown below. Refer to the Proportional Hazards Regression process description for more information. Output from the process is organized into tabs. Each tab contains one or more plots, data panels, data filters, and other elements that facilitate your analysis.
The Results window contains the following panes:
This pane provides you with a space to view individual tabs within the Results window. The following tabs are generated by this process:
|
•
|
Results (Proportional Hazards Regression): Contains one survival plot and box plot using data contained in the modeling results output data set (identified by the _spmr suffix).
|
|
•
|
SAS Output (Proportional Hazards Regression): Lists the output from the SAS procedure used for the Cox survival modeling.
|
|
•
|
Click to reveal the underlying data table associated with the current tab.
|
|
•
|
Click to reopen the completed process dialog used to generate this output.
|
|
•
|
|
•
|
Click to close all graphics windows and underlying data sets associated with the output.
|