Running this process for the Prostate CancerExample sample setting generates two output data sets accessed from a Results window shown below. Refer to the Survival Residuals process description for more information about this process.
The Results window contains the following panes:
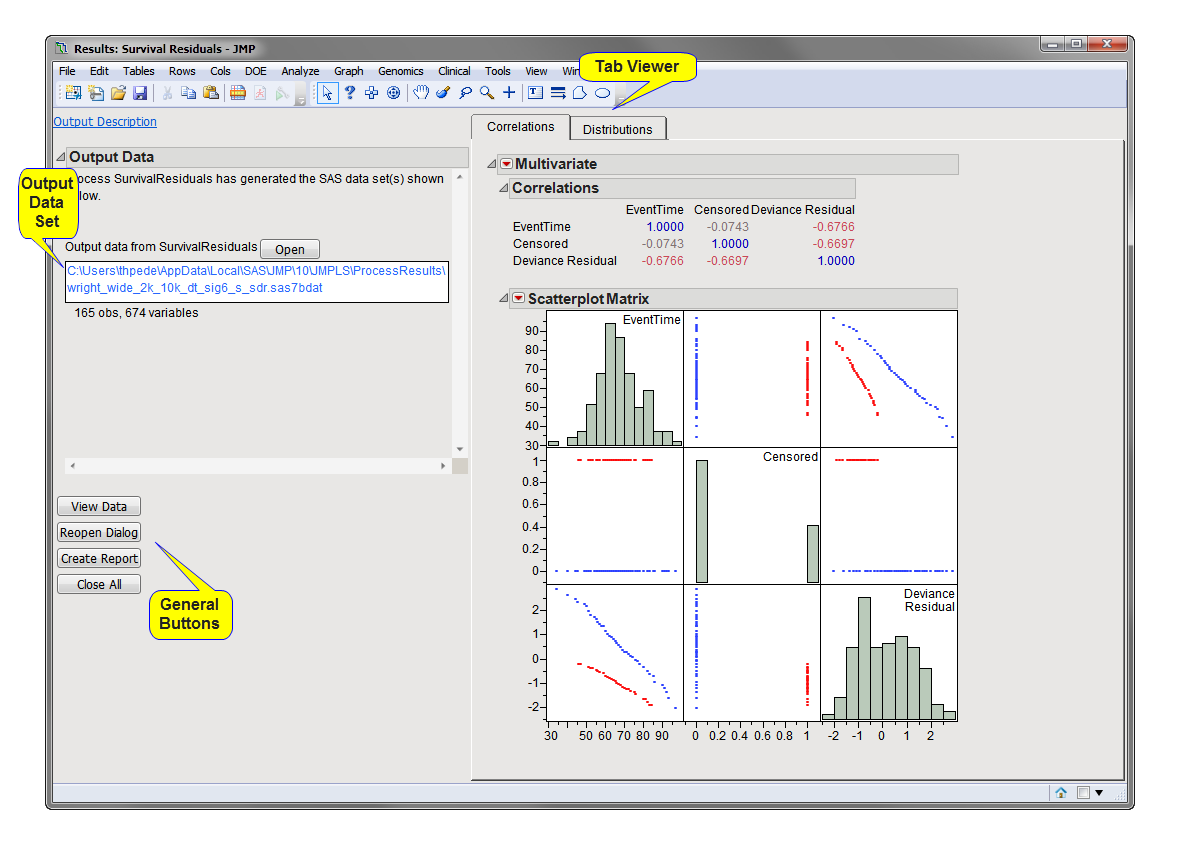
This pane provides you with a space to view individual tabs within the Results window. Use the tabs to access and view the output plots and associated data sets.
|
•
|
Correlations: The tab contains a table of correlations and a Scatterplot Matrix for the Event Time, the Censor Variable, and the Deviance Residual.
|
|
•
|
Distributions: Displays distributions and tables of associated statistics of Event Time, Censor Variable, and Deviance Residual.
|
|
•
|
Survival Residual Output Data Set: This data set contains the deviance residuals. Deviance residuals can be applied as a continuous trait or a dependent variable for other predictive modeling along with other clinic/genomic measurements as predictors. This is a wide data set and is identified by the _sdr suffix.
|
For detailed information about the files and data sets used or created by JMP Life Sciences software, see Files and Data Sets.
|
•
|
Click to reveal the underlying data table associated with the current tab.
|
|
•
|
Click to reopen the completed process dialog used to generate this output.
|
|
•
|
|
•
|
Click to close all graphics windows and underlying data sets associated with the output.
|