Running this process using the Nicardipine _patient_died sample setting generates the tabbed Results window shown below. Refer to the Optimal Treatment Regime process description for more information. Output from the process is organized into tabs. Each tab contains one or more plots, data panels, data filters, and other elements that facilitate your analysis.
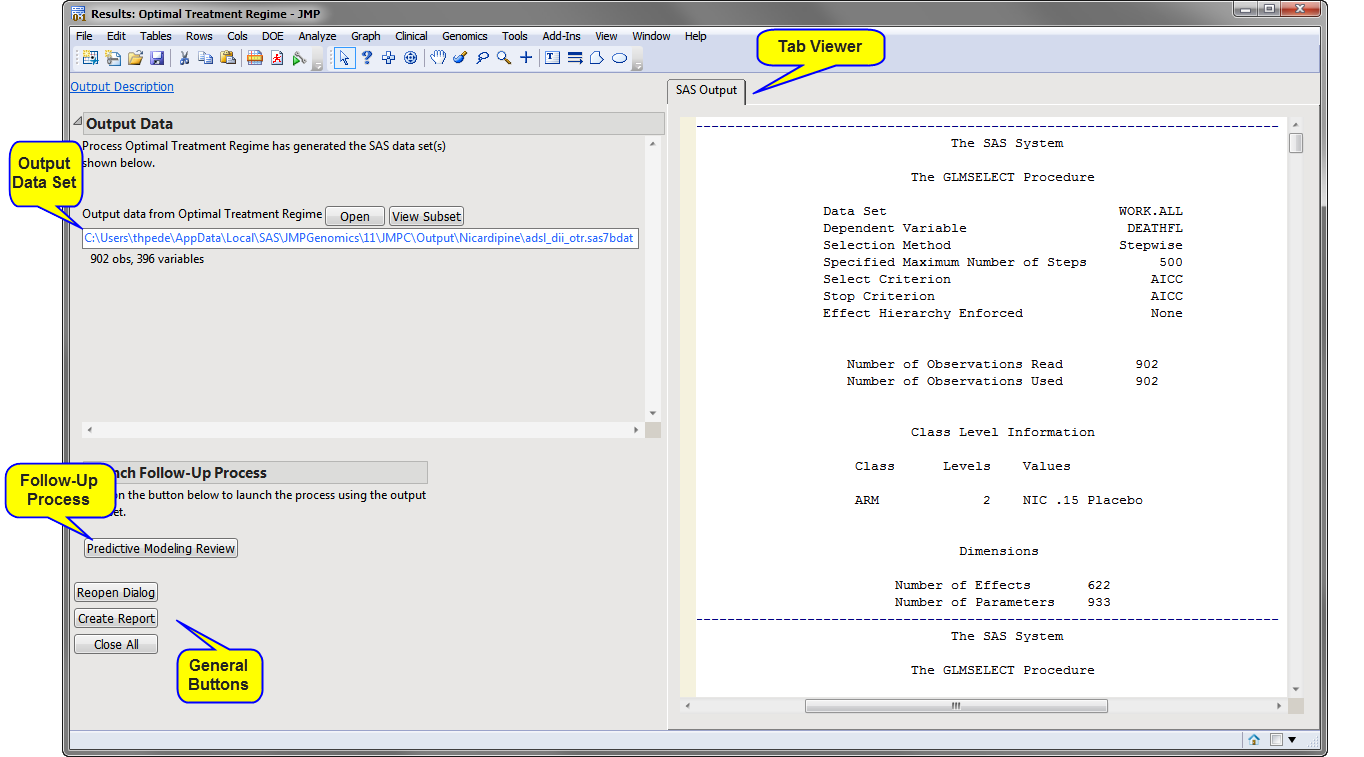
The Results window contains the following panes:
|
•
|
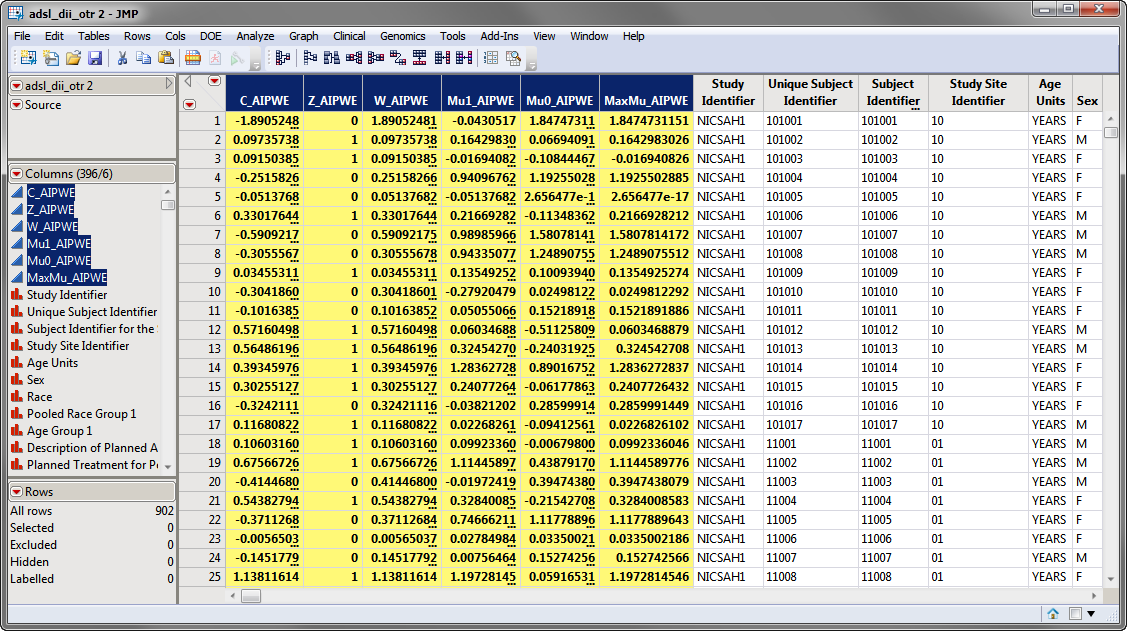
Output Data Set: The output data set (shown below, denoted by the appended _otr suffix) containing the input data and several additional columns (highlight below) inserted at the beginning of the table: two columns containing the estimated mean for the treated (Mu1_AIPWE) and control (Mu0_AIPWE) groups plus a column indicating the larger of the two estimates (MaxMu_AIPWE), a column (C_AIPWE) with contrast response values (differences between Mu1_AIPWE and Mu0_AIPWE), a column of pseudo binary response values (Z_AIPWE), and a column with weight values (W_AIPWE). This data set is ready for input to predictive modeling routines.
|
|
|
Click to open the output data set in JMP.
|
|
|
Click to open the Check Data Contents process
|
|
•
|
Predictive Modeling Review: Click to launch the Review process for the generated model fits with the output from the Optimal Treatment Regime process is preloaded as input.
|
This pane provides you with a space to view individual tabs within the Results window. Use the tabs to access and view the output plots and associated data sets.
|
•
|
SAS Output: Lists the output from the SAS procedure used to fit the models.
|
|
•
|
Click to reopen the completed process dialog used to generate this output.
|
|
•
|
|
•
|
Click to close all graphics windows and underlying data sets associated with the output.
|