The Correlation and Grouped ScatterPlots process computes correlations and scatterplot matrices for expression measurements across groups of arrays. This process also merges annotations for each gene with the measurements to quickly provide information about genes of interest.
The first data set, the Input Data Set, contains all of the numeric data to be analyzed. This data set must be in the tall format where each sample corresponds to one row and each column corresponds to a separate experimental condition or array.
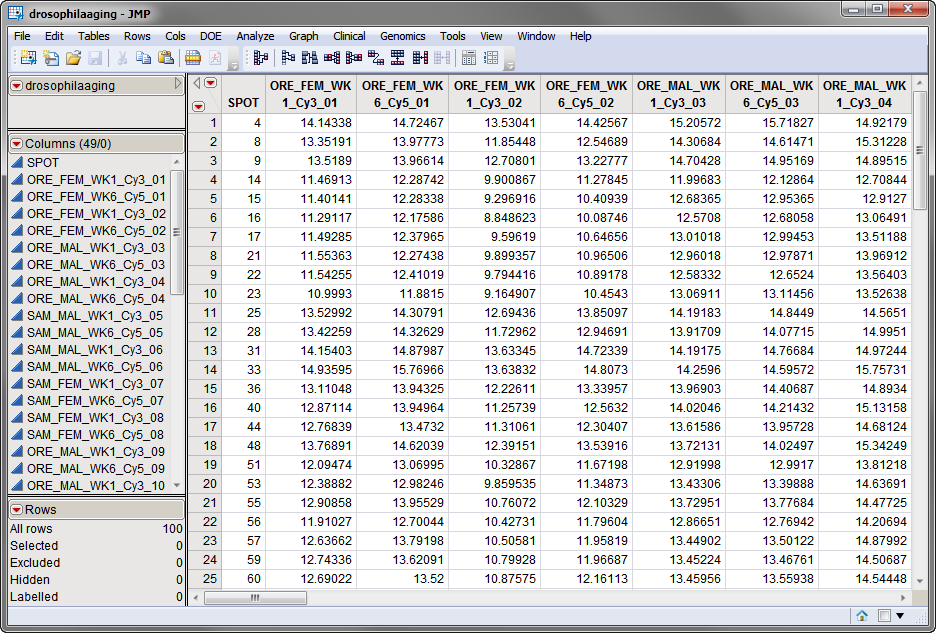
The drosophilaaging.sas7bdat data set, shown below, is a normalized data set derived from the Drosophila Aging experiment described in Sample Case Studies. It has 49 columns and 100 rows corresponding to 49 arrays and 100 individual probes, respectively.
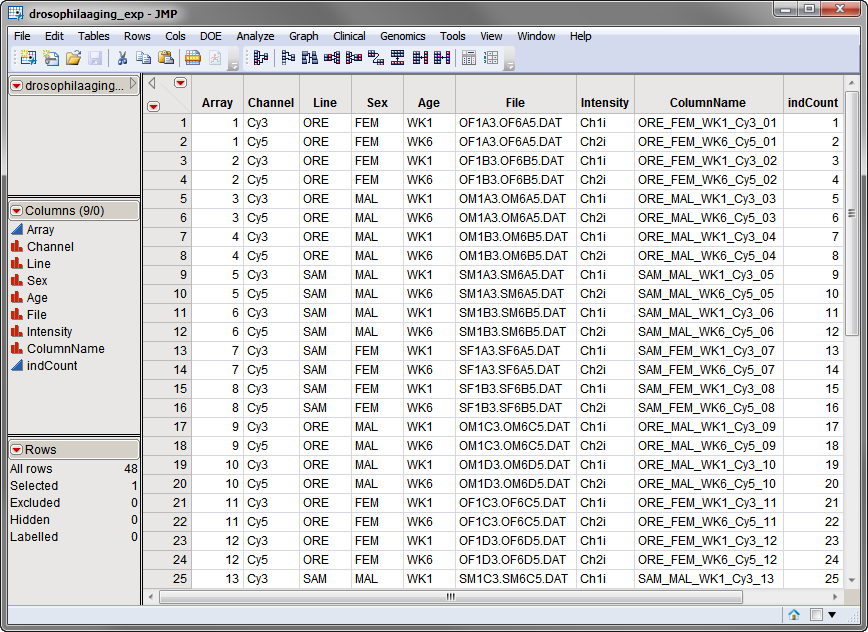
The second data set is the Experimental Design Data Set (EDDS). This required data set tells how the experiment was performed, providing information about the columns in the input data set. Note that one column in the EDDS must be named ColumnName and the values contained in this column must exactly match the column names in the input data set.
The drosophilaaging_exp.sas7bdat EDDS, is shown below. Note that the ColumnName column lists the column names in the input data set. The Array column corresponds to an index variable. Note the variables describing experimental conditions.
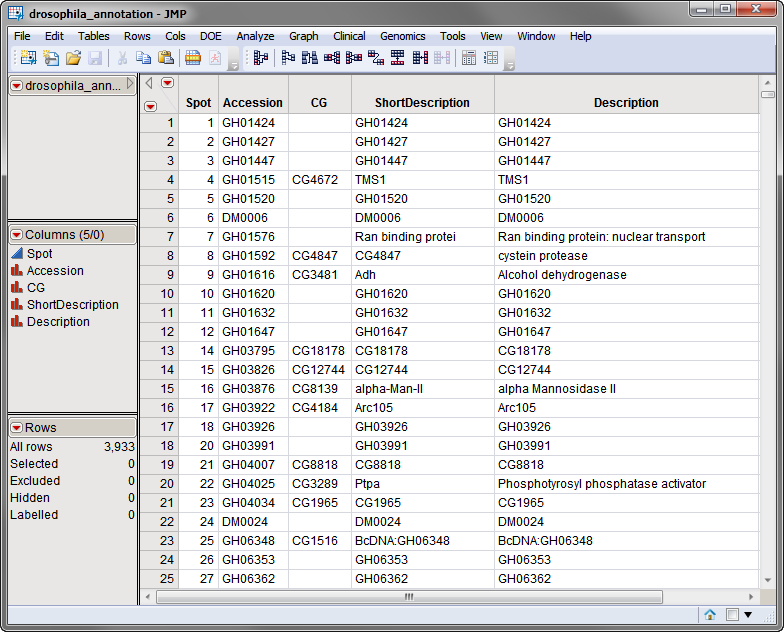
A third, optional, data set is the Annotation Data Set. This data set contains information, such as gene identity or chromosomal location, for each of the markers. The annotation data set used in this example, the drosophila_annotation.sas7bdat data set, identifies accession numbers and gene identities. A portion of this data set is illustrated below. This data set is a tall data set; each row corresponds to a different marker.
The drosophilaaging_norm.sas7bdat, drosophilaaging_exp.sas7bdat, and drosophila_annotation.sas7bdat data sets are included in the Sample Data folder.
For detailed information about the files and data sets used or created by JMP Life Sciences software, see Files and Data Sets.
The output generated by this process is summarized in a Tabbed report. Refer to the Correlation and Grouped Scatterplots output documentation for detailed descriptions and guides to interpreting your results.