The Case-Control Association process provides a quick and relatively easy method for association mapping of a trait using genetic marker data. This method, which uses a chi-square test, operates with the assumption that individuals are both unrelated in recent generations and are classifiable according to some phenotype. The trait to be mapped must be binary with two generic levels, case and control, that are assigned depending on the nature of the trait and the preference of the investigator. Derived p-values for the association are plotted against the physical location of specific markers to identify regions of significance.
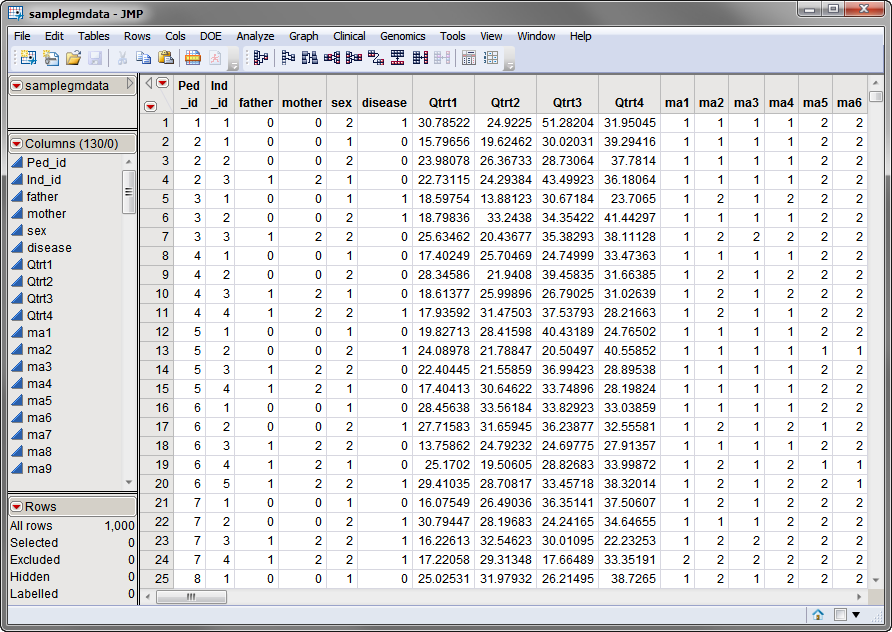
One Input Data Set is needed for this process. The samplegmdata.sas7bdat data set used in the following example was computer generated and consists of 1000 rows of individuals with 130 columns corresponding to data on these individuals. There are 2 categorical phenotypic variables (sex and disease status) and 4 quantitative phenotypic variables (Qtrt1, Qtrt2, Qtrt3, and Qtrt4). Genotypes for 60 different markers are presented in the two-column allelic format (ma1 — ma120). This data set is partially shown below.
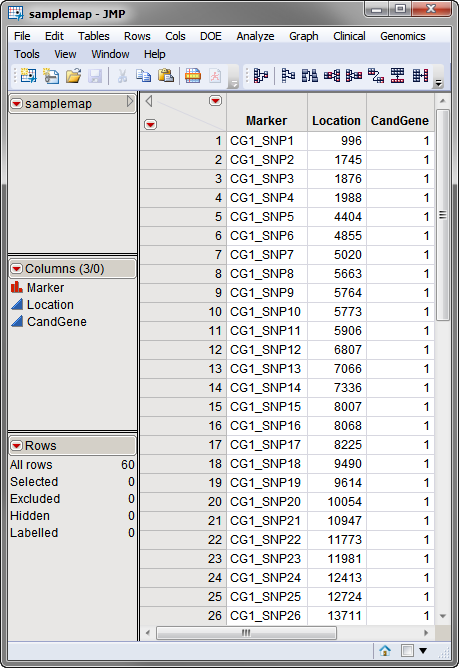
The second, optional, data set is the Annotation Data Set. This data set contains information, such as gene identity or chromosomal location, for each of the markers. The annotation data set used in this example, the samplemap data set, was computer generated and identifies markers, location and gene identities. A portion of this data set is illustrated below. This data set is a tall data set; each row corresponds to a different marker.
Note: The top-to-bottom order of the rows in the annotation data set matches the left-to-right order of the columns in the input data set. This correspondence is required for markers to be matched appropriately.
Both data sets are described in Data Sets Used in JMP Genomics Processes and are included in the Sample Data folder.
For detailed information about the files and data sets used or created by JMP Life Sciences software, see Files and Data Sets.
The output generated by this process is summarized in a Tabbed report. Refer to the Case-Control Association output documentation for detailed descriptions and guides to interpreting your results.