Large scale genetic mapping studies seek to associate genetic markers, such as SNPs, of known location, with various quantitative and qualitative phenotypic traits. Marker-Trait Association tests for association between various types of traits and marker genotypes or alleles from a single marker at a time.
The Marker-Trait Association process can perform either an ANOVA based on marker genotypes or a regression testing for a linear trend of marker alleles. Adjustments can be made for quantitative covariates and random effects or for some trait types, strata variables. P-values from these tests, with adjustments (including for Q and K matrices representing population structure and relatedness, respectively) applied if requested, are plotted along the marker map.
See the MIXED, GLIMMIX, LOGISTIC, and PHREG procedures in the SAS/STAT User's Guide for more information.
Note: Large scale genetic mapping studies frequently require the use of very large data sets. Analysis using the Marker-Trait Association process often takes an inordinate amount of time and computer resources. When analyzing SNPs or multiallelic markers that can be treated as SNPs based on the most frequent allele, you should consider using the SNP-Trait Association process.
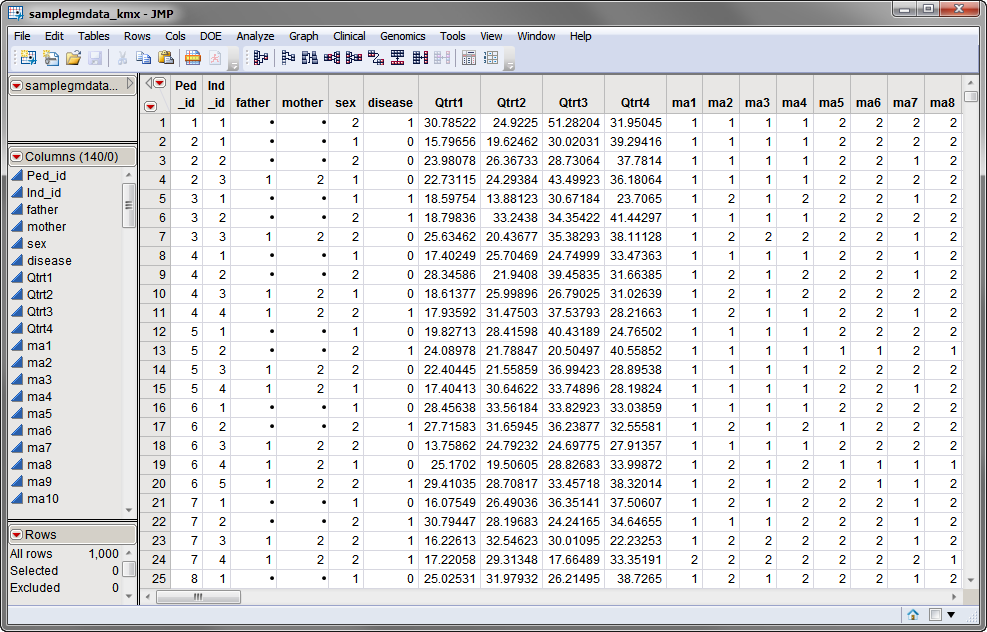
One data set is needed for this process. The Input Data Set, contains all of the marker data and other effects needed for association testing. The computer-generated samplegmdata.sas7bdat data set, described in Data Sets Used in JMP Genomics Processes, was modified using the Kinship Matrix process, as described, to generate the samplegmdata_kmx.sas7bdat data set. The samplegmdata.sas7bdat data set, which is shown below, consists of 1000 rows of individuals with 130 columns corresponding to marker data on these individuals. This data set also contains 7 columns appended to the end, by the Kinship Matrix process, which list the coefficients from the Cholesky root of each pedigree covariance matrix. These coefficients are used in the following association example as random effects in order to analyze family data. Note that this is a wide data set; markers are listed in columns, whereas individuals are listed in rows.
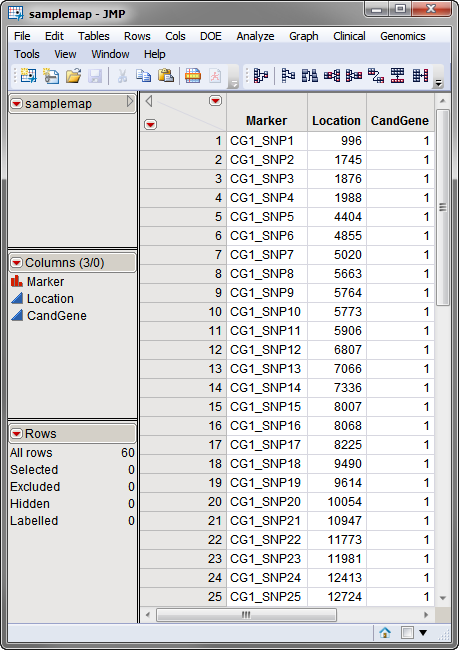
A second, optional, data set is the Annotation Data Set. This data set contains information, such as gene identity or chromosomal location, for each of the markers. The annotation data set used in this example, the samplemap.sas7bdat data set, was computer generated and identifies markers, location and gene identities. A portion of this data set is illustrated below. This data set is a tall data set; each row corresponds to a different marker.
Note: The top-to-bottom order of the rows in the annotation data set matches the left-to-right order of the columns in the input data set. This correspondence is required for markers to be matched appropriately.
Both data sets are included in the Sample Data folder that comes with JMP Genomics.
For detailed information about the files and data sets used or created by JMP Life Sciences software, see Files and Data Sets.
The output generated by this process is summarized in a Tabbed report. Refer to the Marker-Trait Association output documentation for detailed descriptions and guides to interpreting your results.