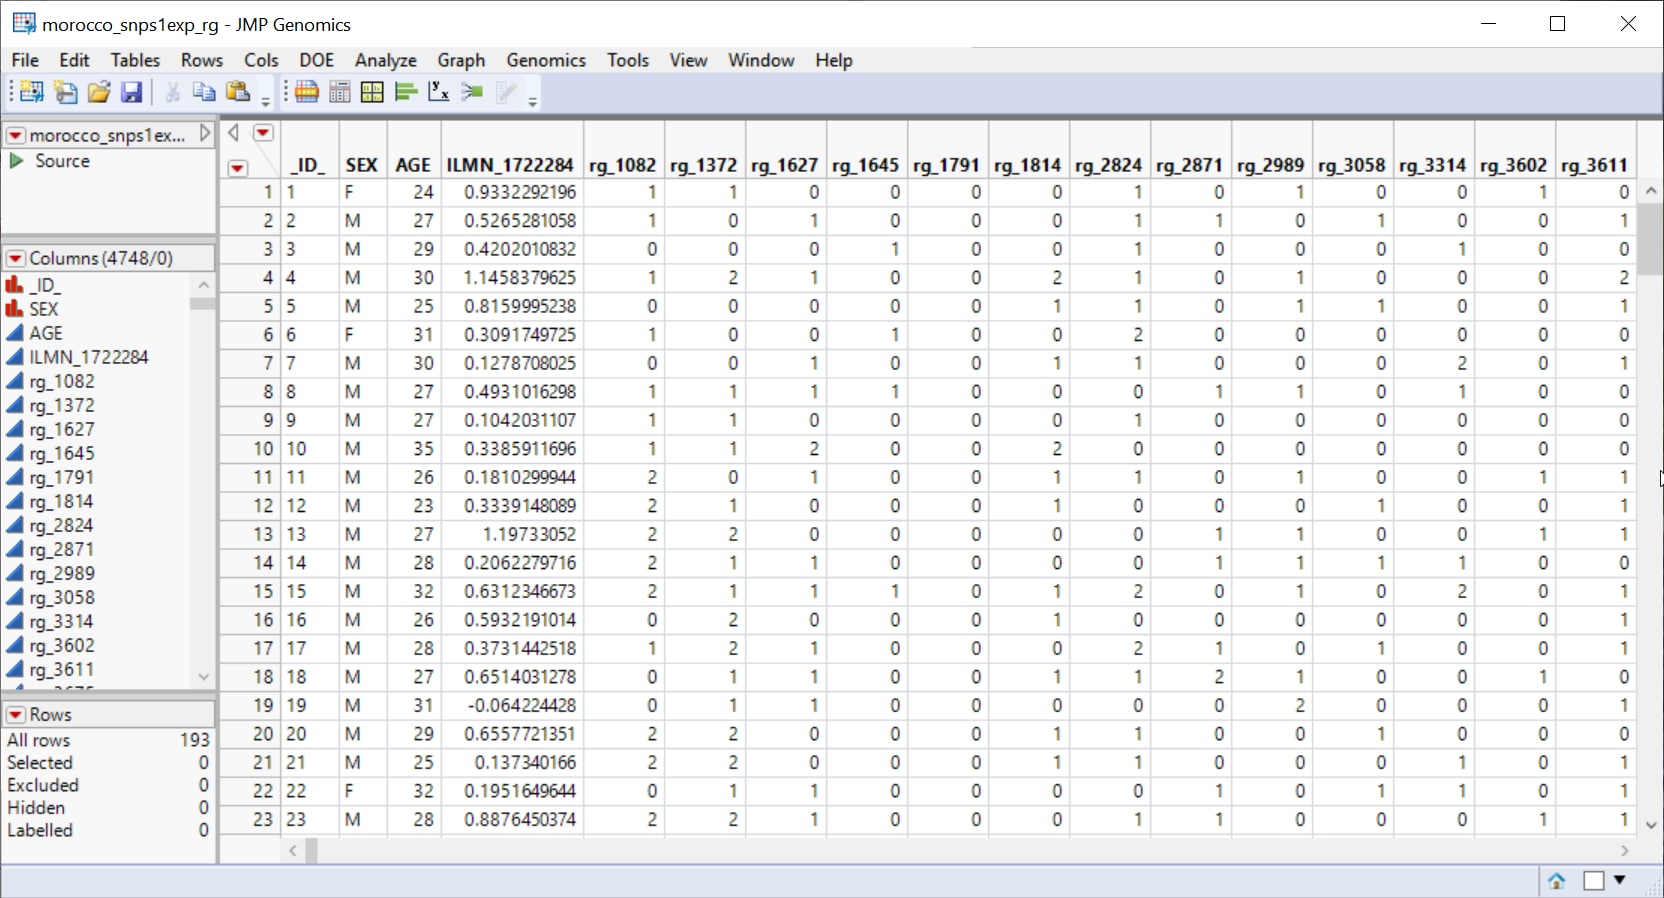
One Input Data Set, containing all of the marker data, is required for this process. The sample data set used in the following example, the morocco_snps1exp_rg.sas7bdat data set, represents the data from a study of gene expression variation and SNP associations in southern Morocco (Idaghdour, Czika, et al., 2010). The SNP markers have been renamed using the Recode Genotypes process.
Note: The data was modified slightly to preserve anonymity of subjects.
It lists genotype data at 4744 SNPs in 193 individuals. Marker data is presented in the one-column format. This data set is partially shown below. Note that this is a wide data set; markers are listed in columns, whereas individuals are listed in rows.
A second, optional, data set is the Annotation Data Set. This data set contains information, such as gene identity or chromosomal location, for each of the markers. The morocco_anno_rg.sas7bdat annotation data set is used in this example. A portion of this data set is illustrated below. This data set is a tall data set; each row corresponds to a different marker.
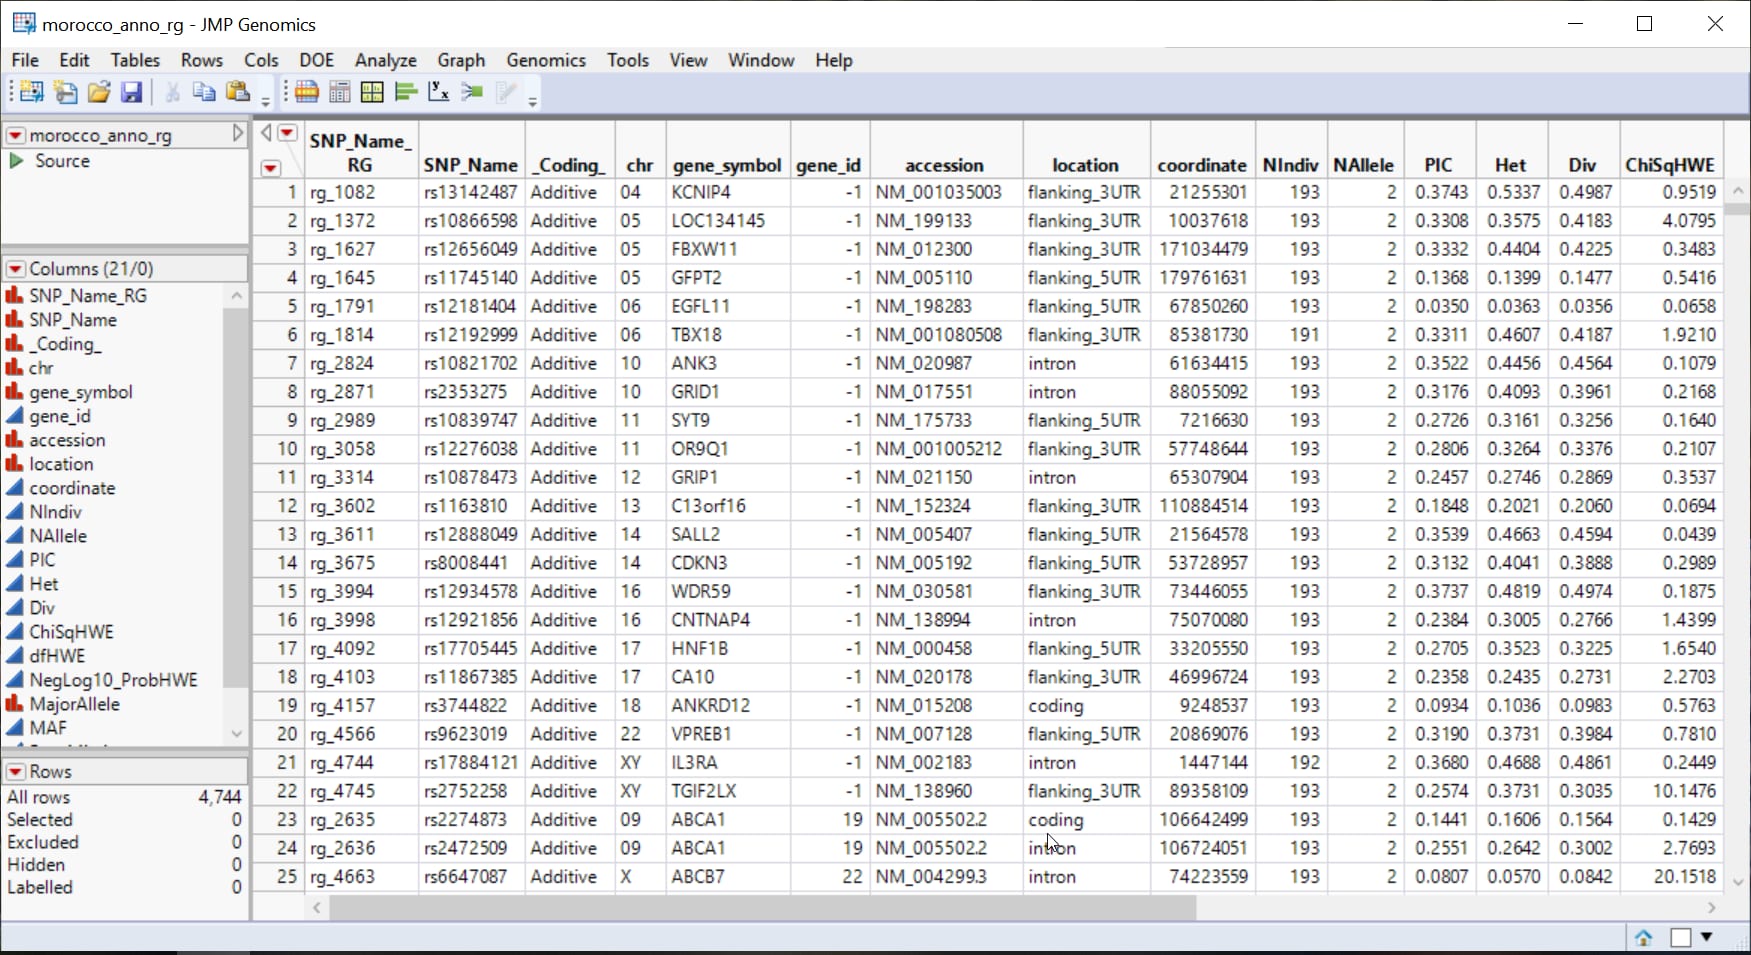
Note: The top-to-bottom order of the rows in the annotation data set matches the left-to-right order of the columns in the input data set. This correspondence is required for this process.
For detailed information about the files and data sets used or created by JMP Life Sciences software, see Files and Data Sets.
The output generated by this process is summarized in a Tabbed report. Refer to the Population Admixture output documentation for detailed descriptions and guides to interpreting your results.