Principal components analysis (PCA) is a multivariate technique for examining relationships among many quantitative variables. Each principal component is a linear combination of the original variables, with coefficients equal to the eigenvectors of the correlation or covariance matrix. The first principal component has the largest variance of any unit-length linear combination of the observed variables, and the jth principal component has the largest variance of any unit-length linear combination orthogonal to the first j-1 principal components. A PCA produces scores corresponding to both rows and columns. You can plot these scores separately or together in a biplot.
One data set is required to run the Principal Components Analysis process. This data set must be in a rectangular format and contain the variables (columns) whose observations (rows) are to be clustered.
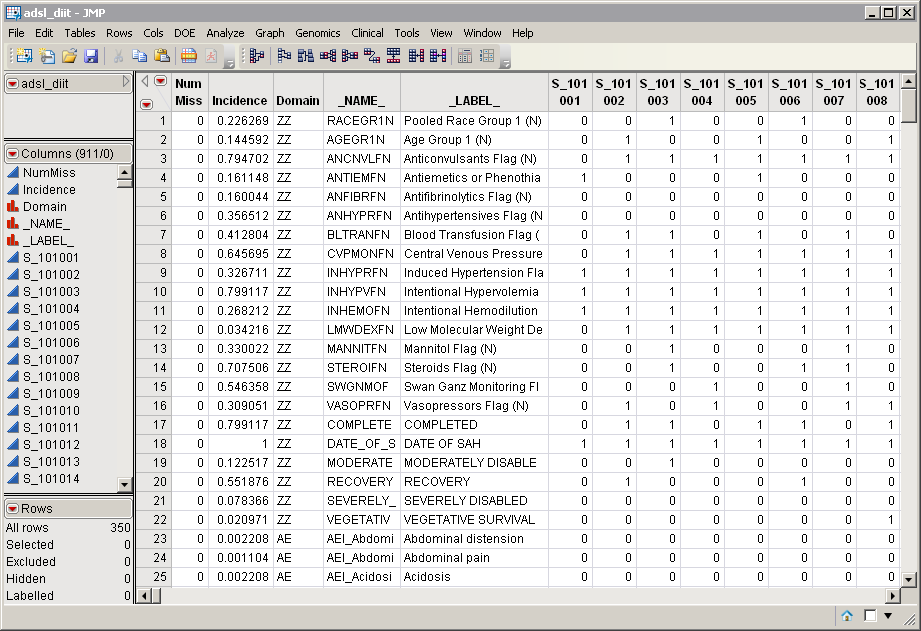
The adsl_diit.sas7bdat data set, shown below, was generated from the included Nicardipine data set. Patients are listed in columns, domain data are listed in rows. There are 911 columns for 906 patients and 318 rows listing events.
For detailed information about the files and data sets used or created by JMP Life Sciences software, see Files and Data Sets.
The output generated by this process is summarized in a Tabbed report. Refer to the Principal Components Analysis output documentation for detailed descriptions and guides to interpreting your results.