The Distance Matrix process computes various measures of distance or dissimilarity between the observations (rows) of a SAS data set. These proximity measures are stored as a square matrix in an output data set, which can then be used as input for the Multidimensional Scaling process.
The input data set can contain numeric or character variables or both, depending on which proximity measure is used. The number of rows and columns in the output matrix equals the number of observations in the input data set, or if there are By Groups, an output matrix is computed for each BY group with the size determined by the maximum number of observations in any BY group.
The JMP Hierarchical Clustering platform and a Heat Map and Dendrogram is used to display the matrix, and the CLUSTER procedure in SAS/STAT can be performed to do clustering that is based on the Distance Metric specified (where cluster membership can be saved to the output matrix).
Alternatively, if the input data set is already a distance (or dissimilarity) matrix, you can specify that only clustering, using the SAS CLUSTER procedure, is performed.
One Input Data Set is required to run the Distance Matrix and Clustering process. Because the Distance Matrix process calculates the distance between the observations (rows), a wide-formatted data set (in which the rows comprise each of the variables) is normally used as the input data set. If you are working with a tall data set and you want to compute distance between columns, first run the Transpose Rectangular process.
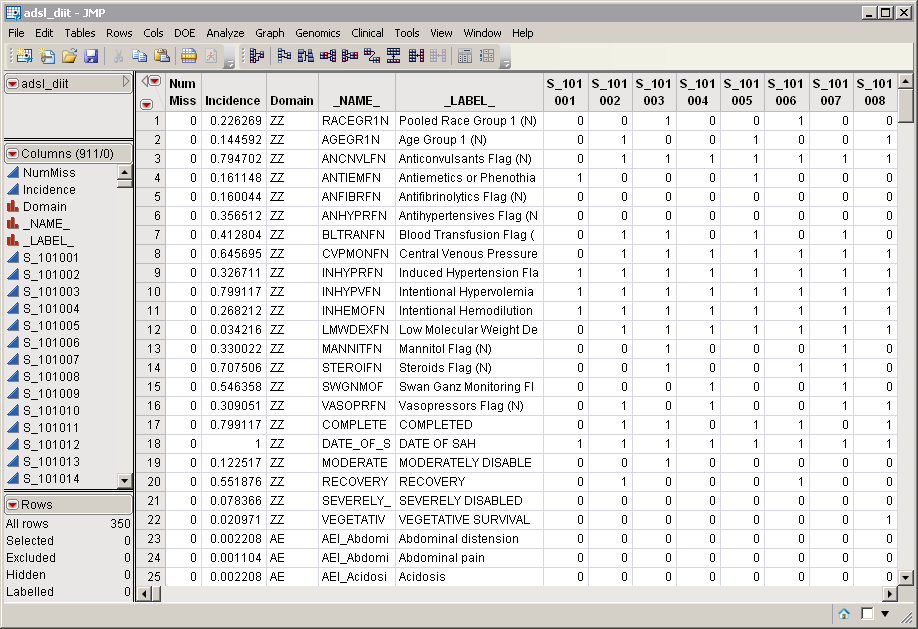
An example data set, the adsl_diit.sas7bdat data set, shown below, was generated by transposition of the adsl_dii.sas7bdat data set. Patients are listed in columns, adverse events are listed in rows. There are 911 columns for 906 patients and 350 rows listing events.
For detailed information about the files and data sets used or created by JMP Life Sciences software, see Files and Data Sets.
The output generated by this process is summarized in a Tabbed report. Refer to the Distance Matrix and Clustering output documentation for detailed descriptions and guides to interpreting your results.