Proportional Hazards Regression is one of a series of predictive modeling processes provided by JMP Clinical and JMP Genomics to help you make the best predictions for your system based on the data that you have collected and analyzed. This process applies a Cox proportional hazards model on survival data with time-to-event variable and optional censor indicator to estimate survival functions and the corresponding median survival time for each row in the input data set. A variety of model selection methods are available, including forward, backward, and stepwise.
Please refer to the SAS/STAT PROC PHREG documentation for details.
Caution: This process can be computationally intensive for large data sets.
Note: This process was called Survival Predictive Modeling in prior releases of JMP Life Sciences software.
One wide Input Data Set is needed to run this process. This data set contains all of the numeric and other data, including mortality statistics, to be analyzed. Data must be in the wide format. Genetic marker data is likely in this form already, but any data that are in tall form must be converted to the wide format. The Transpose Rectangular process can be used to convert the tall data set and its accompanying Experimental Design Data Set (EDDS) to wide form.
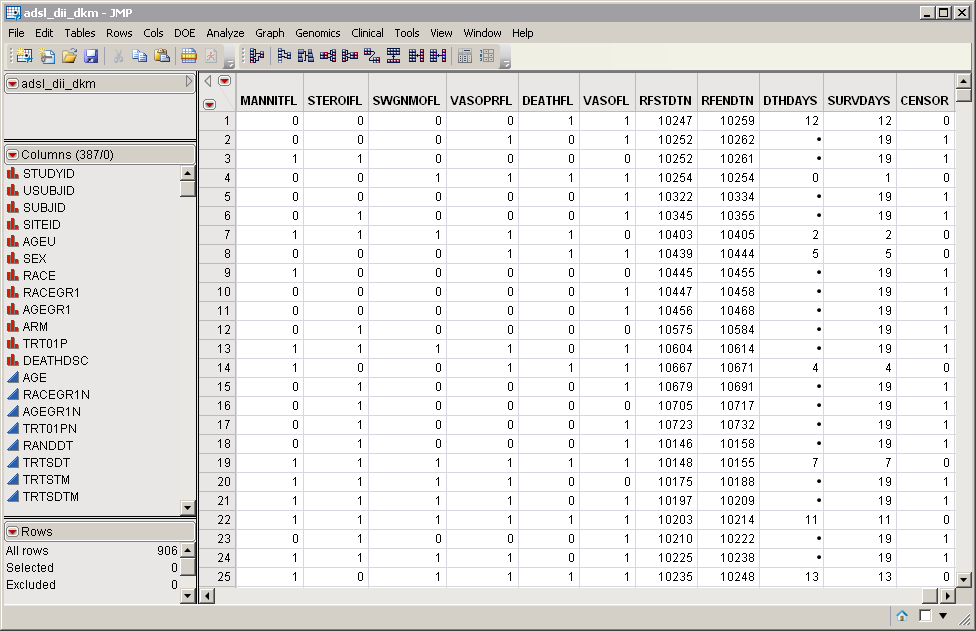
The adsl_dii.sas7bdat data set consists of 902 rows of individuals with 382 columns corresponding to data on these individuals. It was generated from the original nicardipine ADSL data set described in Nicardipine and is included with JMP Clinical. The Mortality Time to Event process was run on this modified data set to add five columns (the last five columns shown below) listing mortality statistics and thus generate the adsl_dii_dkm.sas7bdat data set, used in the following example.
For detailed information about the files and data sets used or created by JMP Life Sciences software, see Files and Data Sets.
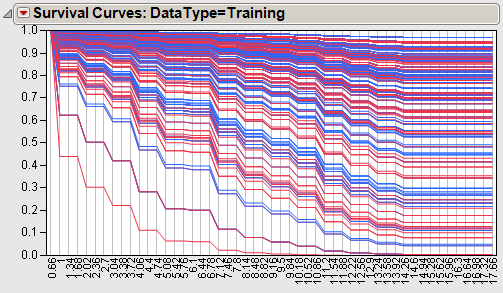
The results generated by the Proportional Hazards Regression process include two data sets and associated plots. The first data set (identified by a _spmv suffix) lists the best predictors of survival, as selected by the predictive model. The second data set (identified by the _spmr suffix) lists the survival functions calculated, based on the predictors listed in the adsl_dii_spmv.sas7bdat data set, for each of the patients in the input data set. Patients are listed in columns and survival times are listed in rows. These are accessed from a tabbed Results report.
The Survival Curves (shown below) plot the survival functions listed in the SurFunc_train.sas7bdat output data set for each patient. Each curve represents one patient and is colored according to range.