P-Value Quantile Plotter
The P-Value Quantile Plotter process is a JMP Scripting Language (JSL) script that enables you to compare observed p-values for a data set with those that might be expected under relevant null hypotheses. This comparison enables you to assess whether the observed data support the null hypotheses. Evaluation of these plots can thus provide indications on how best to proceed with your analysis.
A JMP table containing at least one column of p-values of an arbitrary set of features (for example, genes, probesets, exons, markers) must be open and in focus before you can select and open the P-Value Quantile Plotter dialog.
For detailed information about the files and data sets used or created by JMP Life Sciences software, see Files and Data Sets.
Running this process adds a column (for each P-value variable specified) containing the transformed, observed p-values to the input data set and generates a plot (shown below) of the observed p-values versus the expected p-values for this data set.
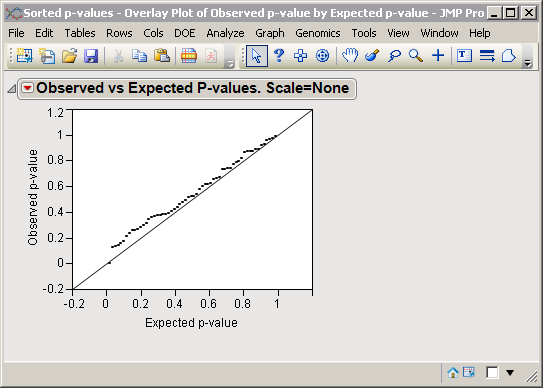
The plot for the expected p-values is represented by the solid line running diagonally upward from the lower left. The observed -log10 p-values for these data are plotted with solid black dots. The observed p-values extending away from the reference line on the right hand side are the ones representing significant differences.