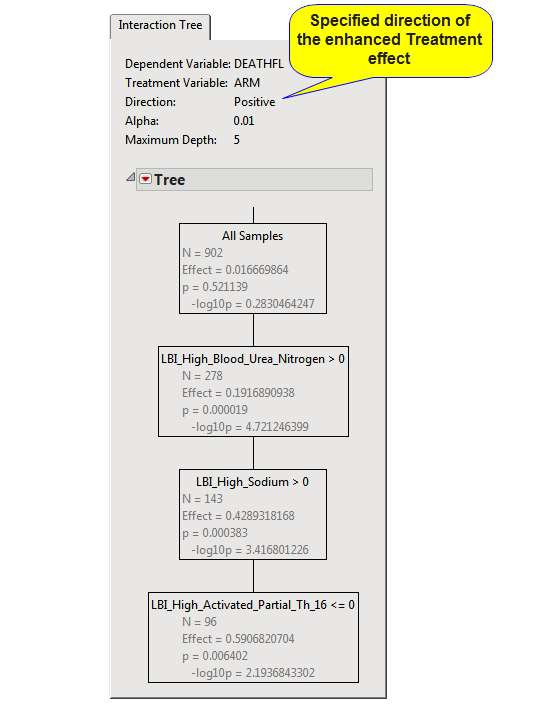
The Interaction Tree tab contains the following element:
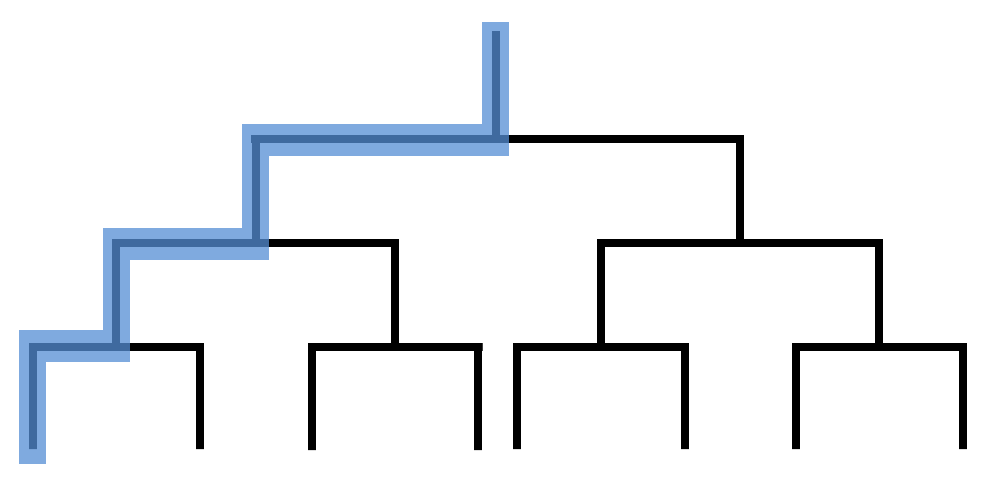
This diagram represents the single branch of the tree model showing the most differentiated treatment effect caused by the interaction of the different treatments with the different predictors. While the entire tree could potentially be generated, as illustrated in the diagram below, only this one branch of the tree (highlighted) is shown on the tab.