The Chromosome Position Plots tab is shown below:
Note: This tab is generated when a Chromosome Variable is specified.
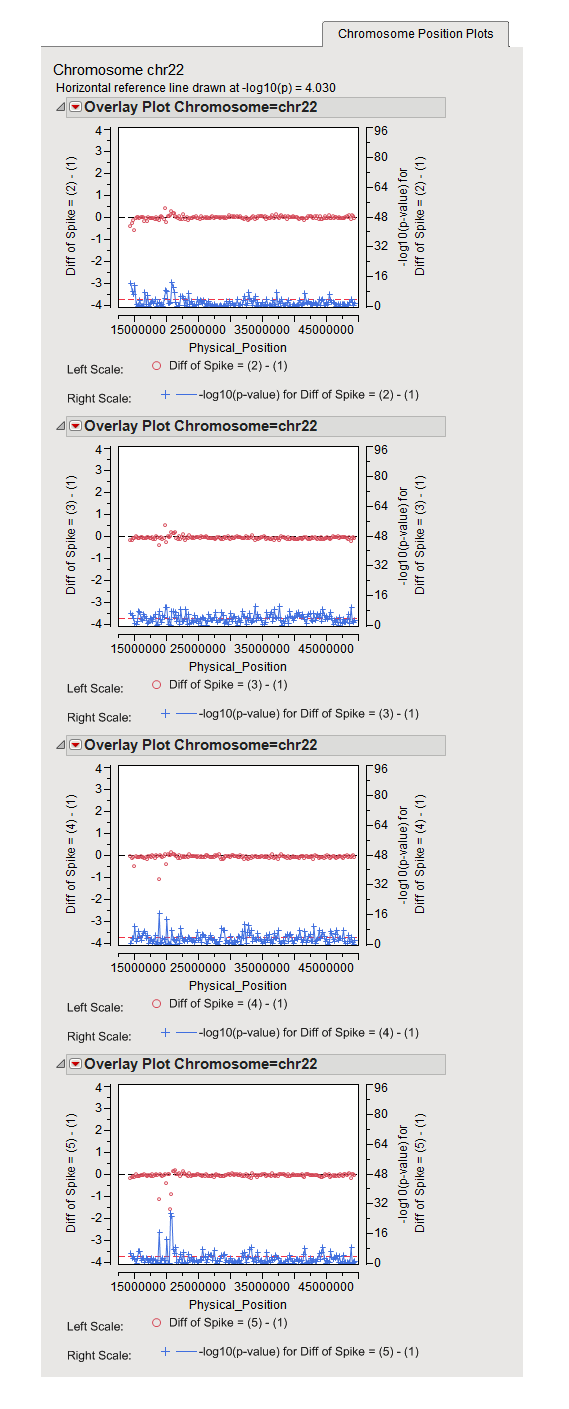
The Chromosome Position Plots tab contains the following elements:
|
•
|
A series of p-Value Plots.
|
There is a separate plot for each set of differences on the selected chromosome. The Y-axis plots p-values: raw p-values are plotted on the left, p-values converted to the -log or -log10 scale on the right. The X-axis plots location of the marker according to the Position Variable .
Horizontal reference lines, one for the p-values and one for the -log10 p-values, are drawn as dashed lines at the significance level that was specified. For -log or -log10-converted p-values, observations above this line are significant; for p-values on the original scale, markers below the line are significant.
On this plot or any of the other p-value plots, simply mouse-over any of the points on the plot to see the name of the marker. When an annotation accession variable is specified when running the process, you can select a point and click on any of the Annotation action buttons to link directly to the corresponding website to view extensive annotation information about the marker.