The TPM Scaling Factors tab is shown below:
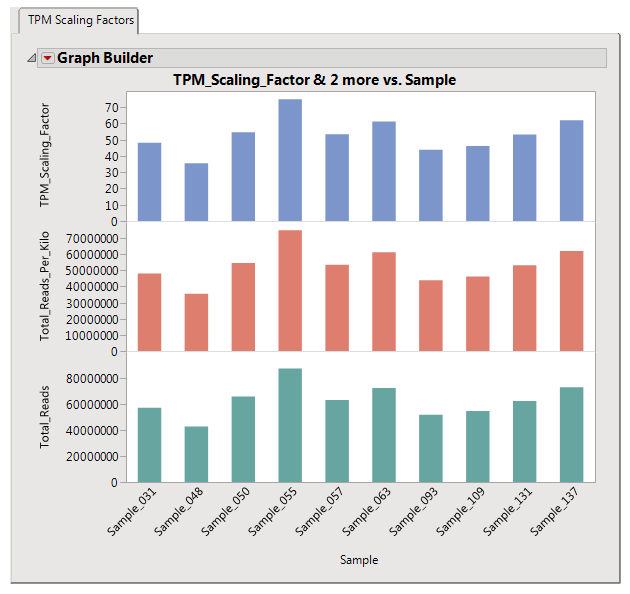
The second chart (red bars, middle) shows the number of reads per kilobase in each of the samples. These values are used in the normalization to account for the fact that, given equivalent levels of transcription, longer genes inherently exhibit a greater number of total reads because the number of target sites increases as the length of the transcript increases.
The third chart (green bars, bottom) shows the total number of mapped reads in each of the samples.