The All P-Value Plots tab is shown below.
Note: This tab is named P-Value Plot when either when no Annotation Group Variable is specified or when there is only one annotation group.
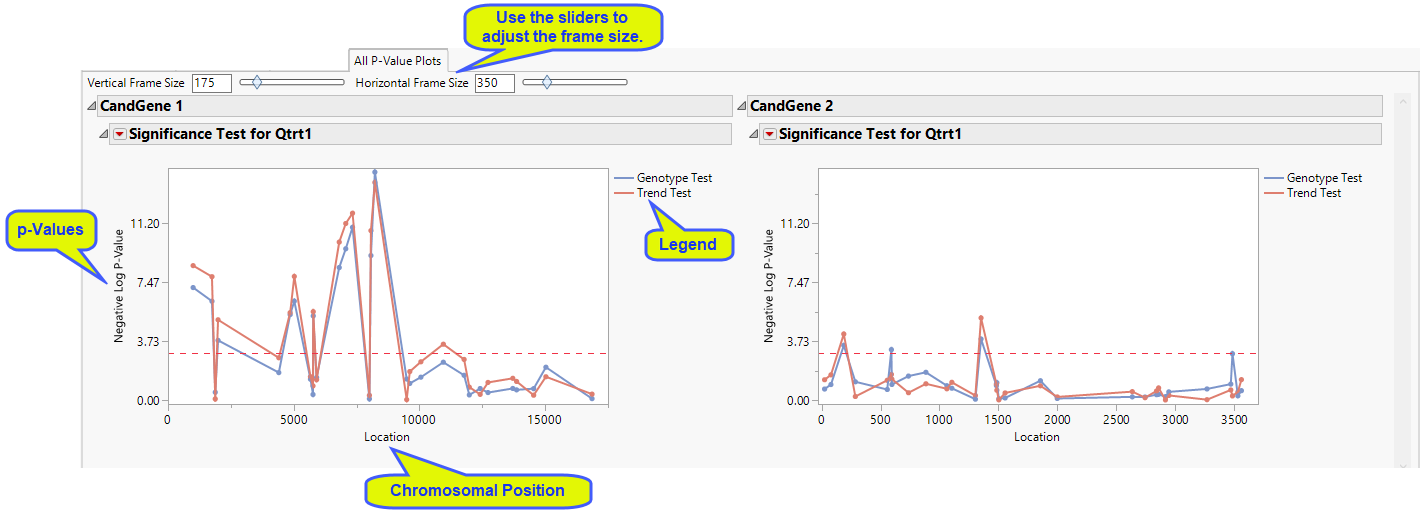
This tab displays the p-value overlay plots from all the annotation groups in a single display. P-values (raw or transformed) are plotted on the y-axis and location is plotted on the x-axis. The horizontal red-dotted line represents the specified significance level.
If no annotation group variable is used or there is only one annotation group, this plot displays a single p-value plot (or multiple plots if any BY variables are selected) from the analysis.
Note: For the Haplotype Estimation process, there is a point for each marker window instead of for each marker.
See Overlay Plot for more information.