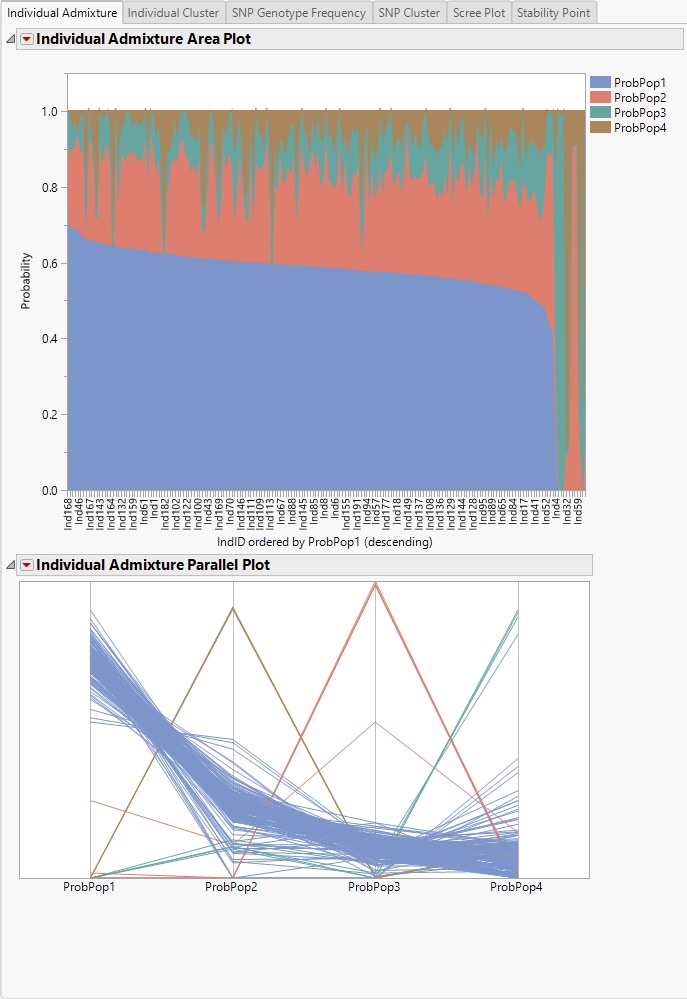
The Individual Admixture tab is shown below:
The Individual Admixture tab contains the following elements:
This graph shows the estimated admixture probabilities of ancestral populations in the y-axis for each individual in the x-axis. Individuals are sorted according the probabilities values of an ancestral population.
This graph displays the nominal level of ancestral populations in the x-axis and values of admixture ancestral probabilities for each individual in the y-axis. Each line in the graph represents an individual.