The Linkage Group and Segregation tab is shown below:
The Linkage Group and Segregation tab contains the following elements:
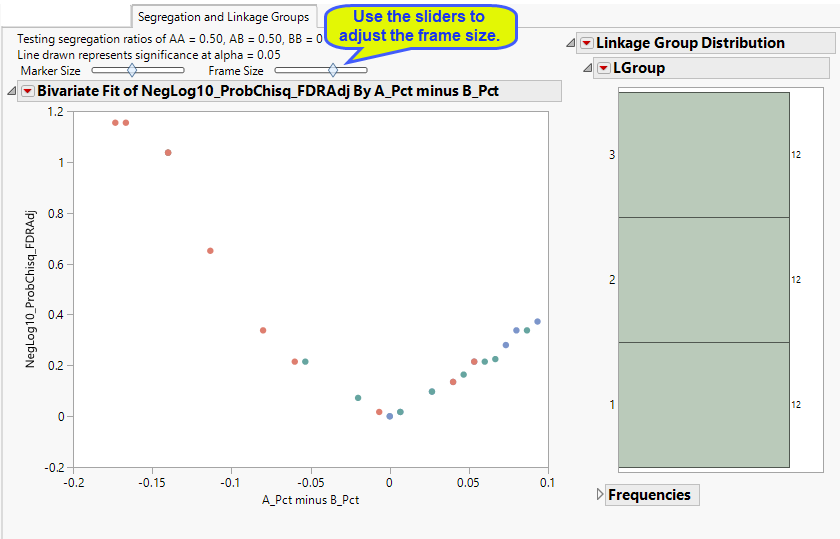
This plot shows a point for each marker in the analysis. The -log10 transformed p-value for the chi-square test (optionally adjusted for multiple testing) for segregation distortion is on the y-axis. The x-axis shows the difference in the percentage of alleles from parental line 1 (denoted as the "A" allele) less the percentage of alleles from parental line 2 (the "B" allele). Markers that are in the upper left or right corners are those that can exhibit unexpected ratios of alleles based on the inbred cross specified on the dialog.
For example, with the BC1_example setting, the experimental population is from a backcross to parental line 1 ("A" allele), so we expect to see frequency ratios of 50% of AA homozygous genotypes to 50% AB heterozygous genotypes. The expected segregation ratios are assumed based on the cross for Backcross, F2, RIL, and DH cross types. This can be customized to test user-supplied expected ratios on the dialog with the Expected Segregation Ratios for AA AB BB parameter.
The markers in this plot are colored by linkage group membership (value of LGroup variable). If a framework map was specified, markers belonging to an original framework group will be denoted with a star marker.
Note: Any markers lying above the red dotted line should be considered in segregation distortion based on the tested allele frequency ratios
|
•
|
One or more linkage group distribution analyses
|
The results shown on this tab are interactive and linked to those shown on the Linkage Group Results tab. You can select marker(s) in the segregation test plot or groups of markers by clicking on the histograms in the distribution analyses. You can then see where these markers lie in the linkage group results on the first tab or choose to exclude selected markers with the Exclude Markers and Rerun Analysis action button.