When there are multiple annotation groups, a Manhattan plot is used to show p-values for all markers from a particular type of test in a single scatter plot.
A Manhattan Plot tab is shown below with markers grouped by chromosome (not necessarily created by this example):
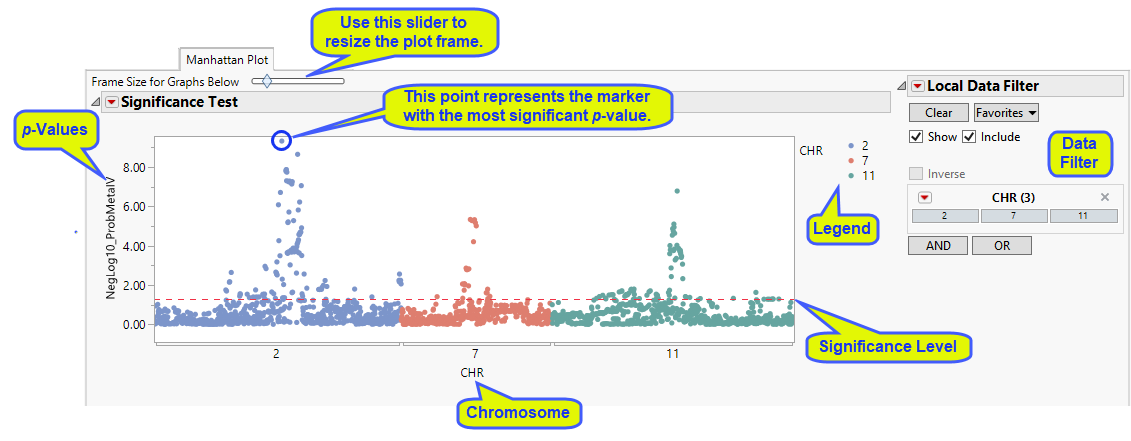
The y-axis variable is the p-value from the meta-analysis test, converted to the -log or -log10 scale if selected in the process dialog. The x-axis plots the markers in cumulative order within and across chromosomes. Each chromosomes is assigned a color that is displayed in a legend below the plots.
A horizontal reference line is drawn as a red, dashed line at the significance level that was specified. For -log- or -log10-converted p-values, markers above this line are significant; for p-values on the original scale, markers below the line are significant. The marker showing the highest significance (SNP rs560887) is circled in the plot above.
On this plot or any of the other p-value plots, simply mouse-over any of the points on the plot to see the marker's label, for example, reference SNP ID. When an annotation accession variable is specified when running the process, you can select a point and click on any of the Annotation action buttons (GenBank Nucleotide, UniGene Database, AceView Database, or dbSNP) to link directly to the corresponding website to view extensive annotation information about the locus.
Also, on this plot or any of the other p-value or heterogeneity plots, you can select markers for which to create forest plots by clicking on the Forest Plot action button. A separate forest plot is created for each selected marker showing the effect estimate (regression coefficient or log odds ratio, for example) for each individual study along with its confidence interval, and the weight for the study (in this case, the inverse of the effect estimate's variance) is represented by the size of the square. A red diamond is centered at the overall estimate with width extending the length of the confidence interval, as shown for marker SNP rs560887 (circled above) below:
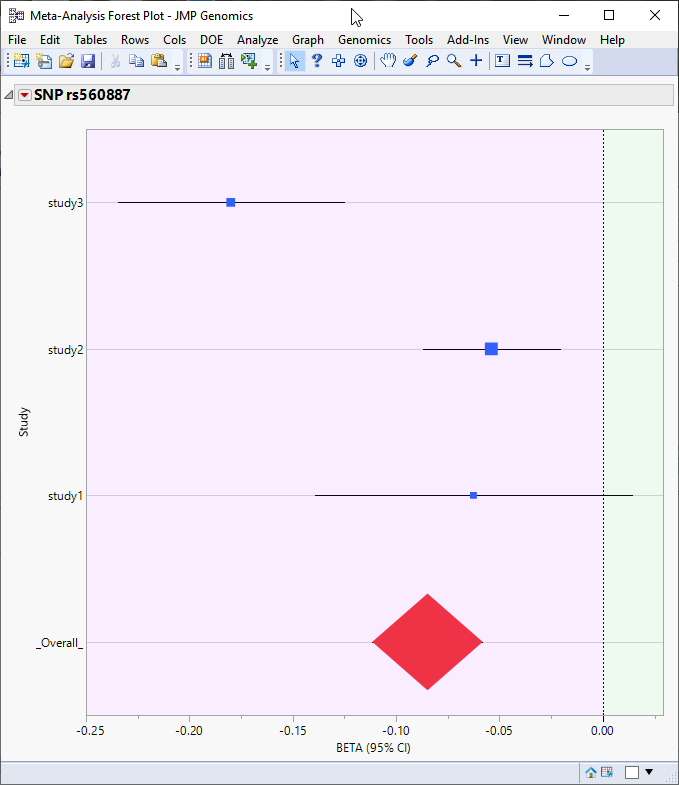
Note: The analysis used in this example consisted of three separate studies.