The Multi-Generations Simulated Trait Means Ordered tab is shown below:
The Multi-Generations Simulated Trait Means Ordered tab contains the following elements:
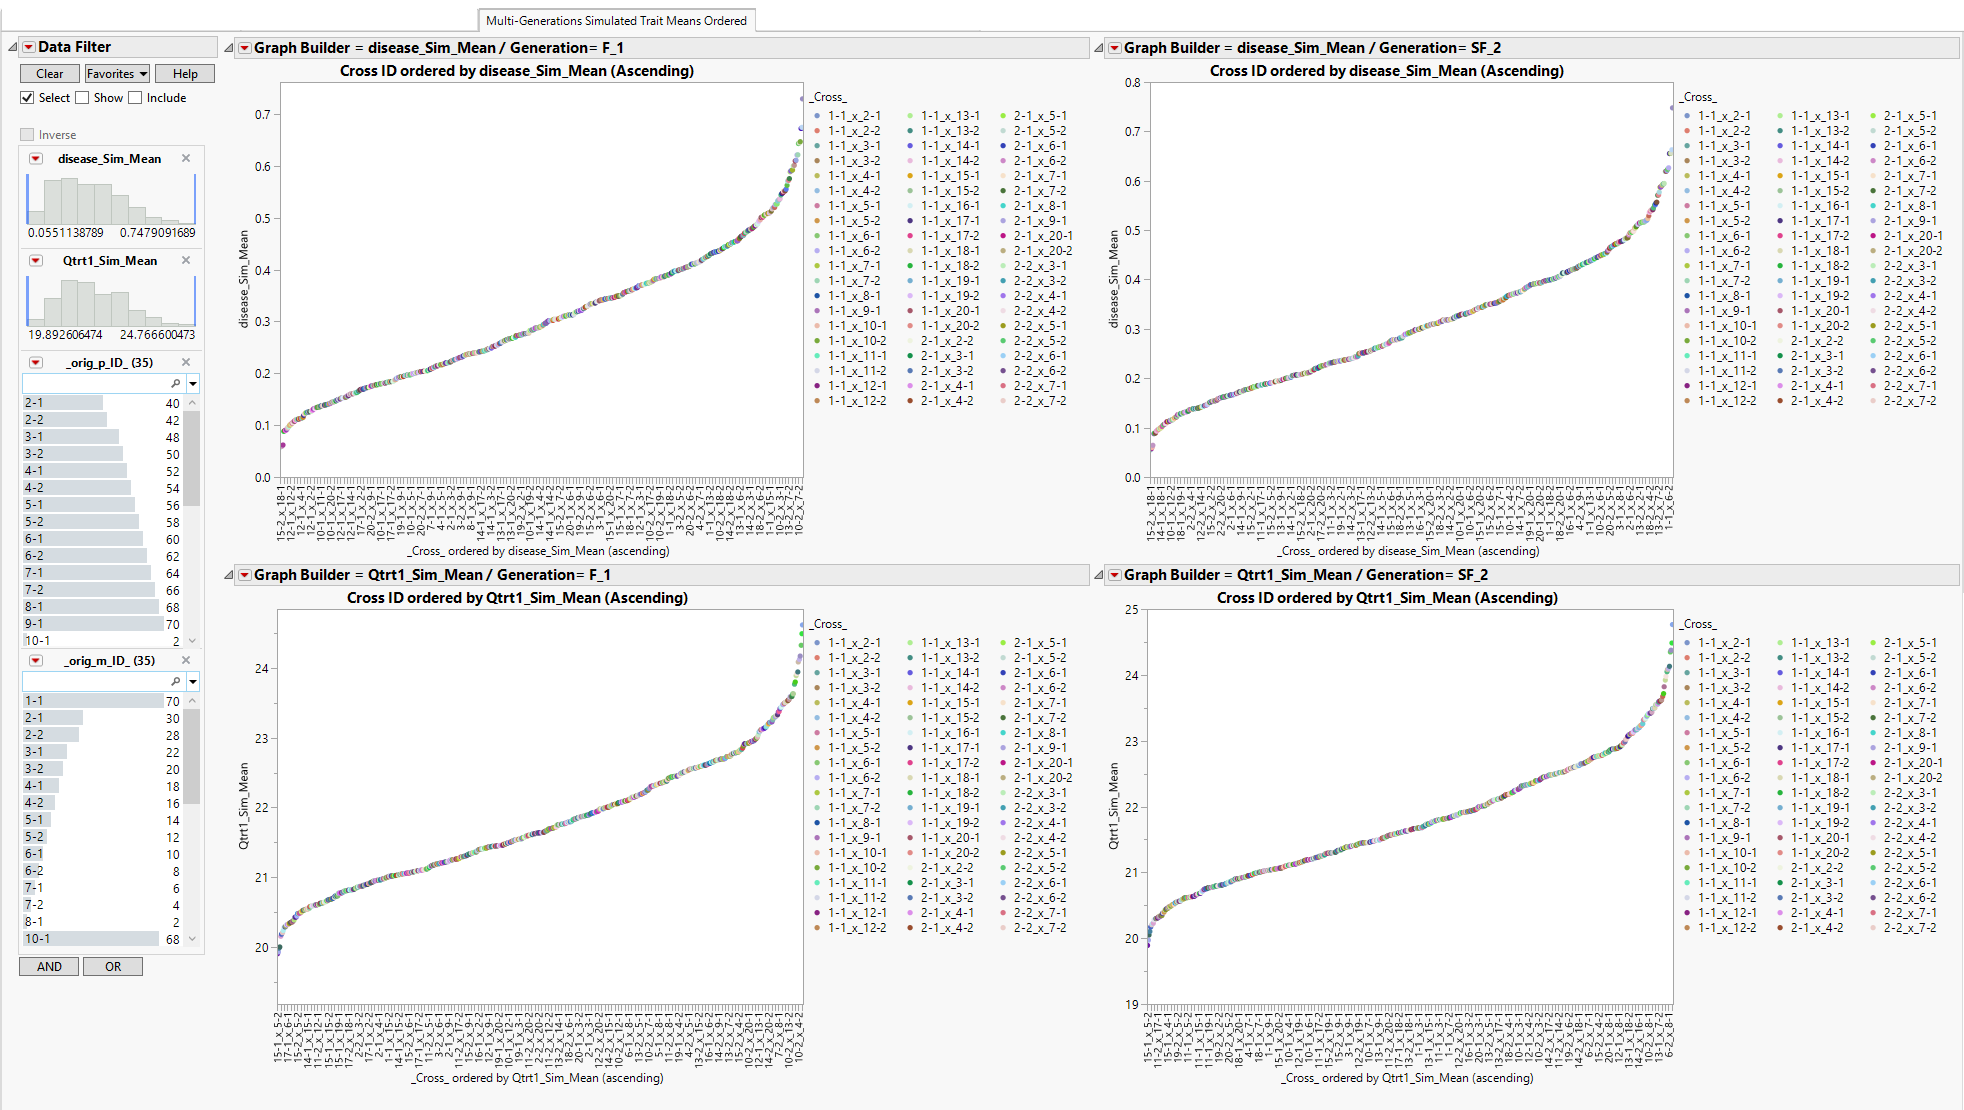
These plots show the average modeled traits for the simulated progenies across generations in the y-axis and their generation-cross IDs in the x-axis. The parents in the x-axis are ordered in ascending values from left to right according to the modeled trait value. There is one plot for each trait and each generation.