The R2 tab is shown below:
The R2 tab contains the following elements:
|
•
|
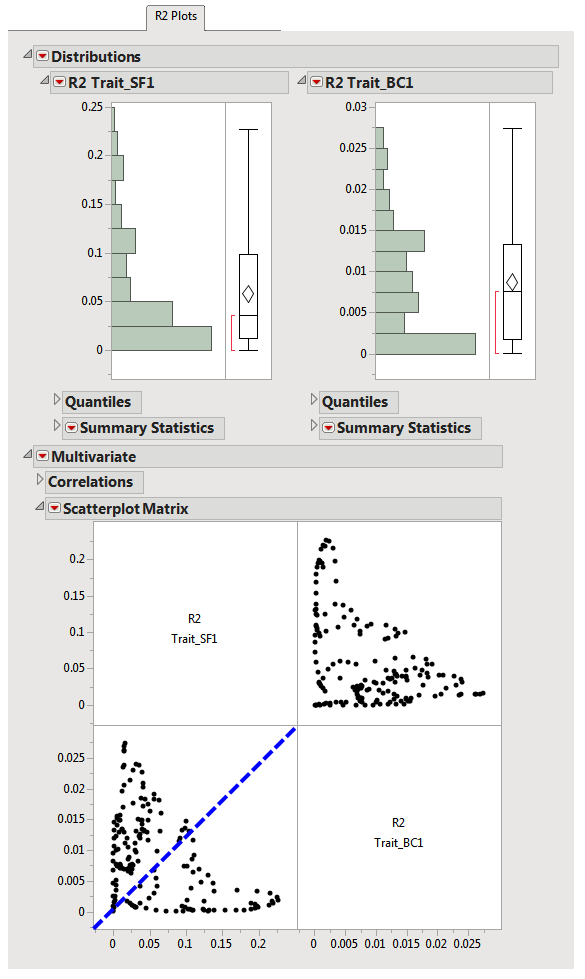
A series of Distributions showing R2 estimates for each QTL testing location for a trait. There is a separate plot for each trait.
|
Higher values of R2 statistics indicate QTL locations that are more associated or show higher heritability with the respective trait.
|
•
|
A multivariate correlation Scatterplot Matrix showing the correlations between the R2 estimates between different traits.
|
This view can be useful to see whether there are QTLs that have high R2 values (are associated or have higher heritability) for multiple traits. For example, if a testing location has a high R2 value for both Trait_BC1 and Trait_SF1 this would indicate that the QTL is associated to both traits. A value like this would fall along the diagonal of the plot (indicated by the dashed line above). The higher and farther to the right along the diagonal, the greater the association between the QTL and the two traits.