The Scree Plot tab is shown below:
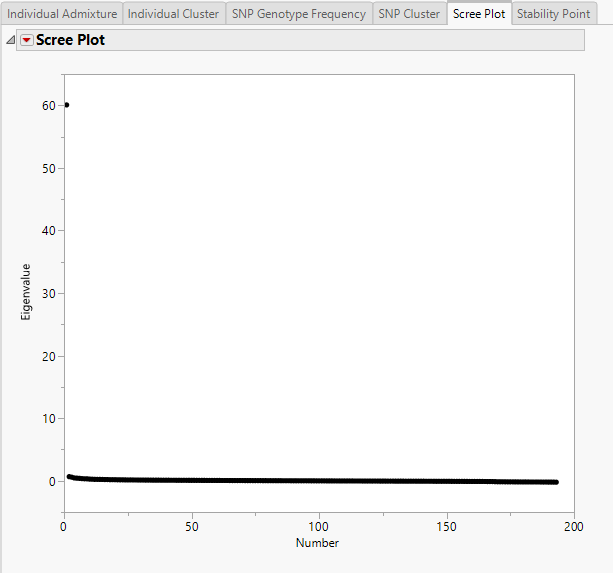
This graph displays the eigenvalues in the y-axis and number of components (putative number of ancestral populations) in the x-axis. This graph can be used to help determining the number of ancestral populations when this parameter is unknown. This graph usually has an elbow shape, and the x-value corresponding to the elbow is considered a good estimate for the number of ancestral populations.
See Scree Plot for more information.