The Scree Plot tab displays a plot of the eigenvalue for the ith component versus i to show the proportion of variation explained by the principal components. This tab is generated when the Perform Principal Components Analysis check box has been checked.
The Scree Plot tab is shown below:
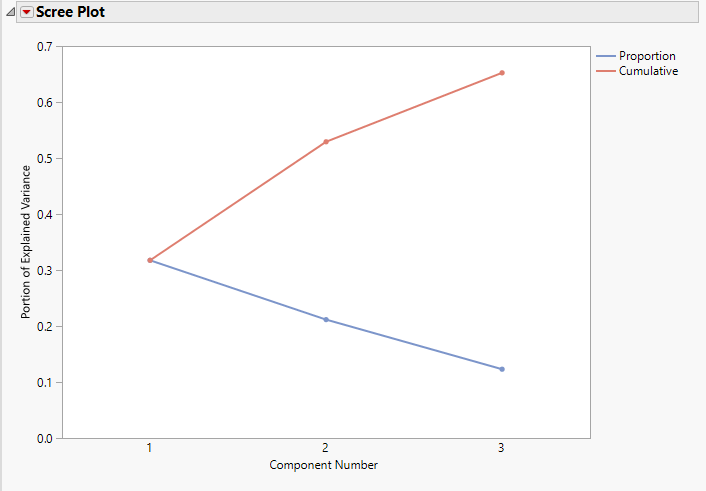
The Scree Plot tab contains the following elements:
This scree plot for the principal components from the linear-bilinear model plots the eigenvalue by principal component in red and the cumulative proportion explained by the PCs in blue. This plot can give you an idea of the number of principal components that are needed to explain most of the variance.
See Scree Plot for more information.