Output | Genetics | Simulated Trait Distribution

Simulated Trait Distribution
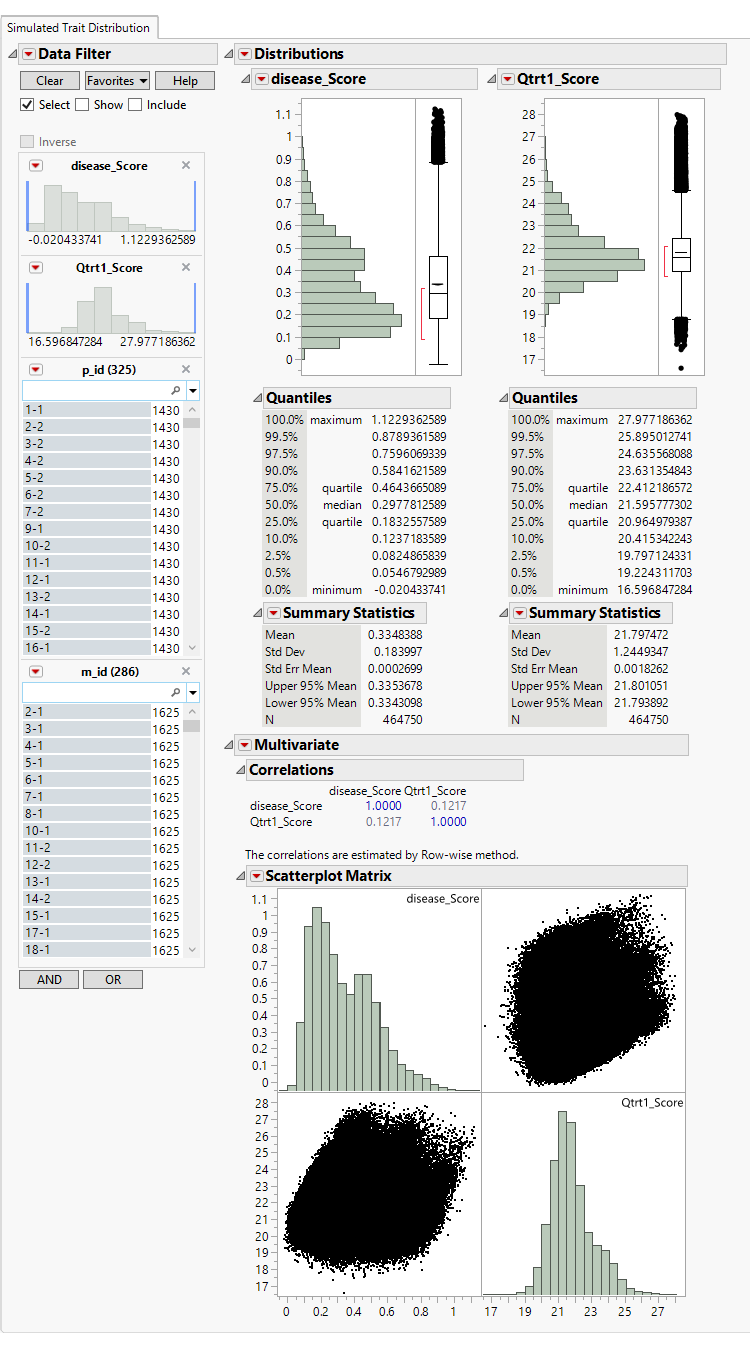
The Simulated Trait Distribution tab is shown below:
The Simulated Trait Distribution tab contains the following elements:
This plot shows the histograms and associated statistics of modeled trait values of simulated progenies across all crosses.
This section shows correlation statistics and a scatterplot matrix of the correlation of modeled traits among progeny of the crosses