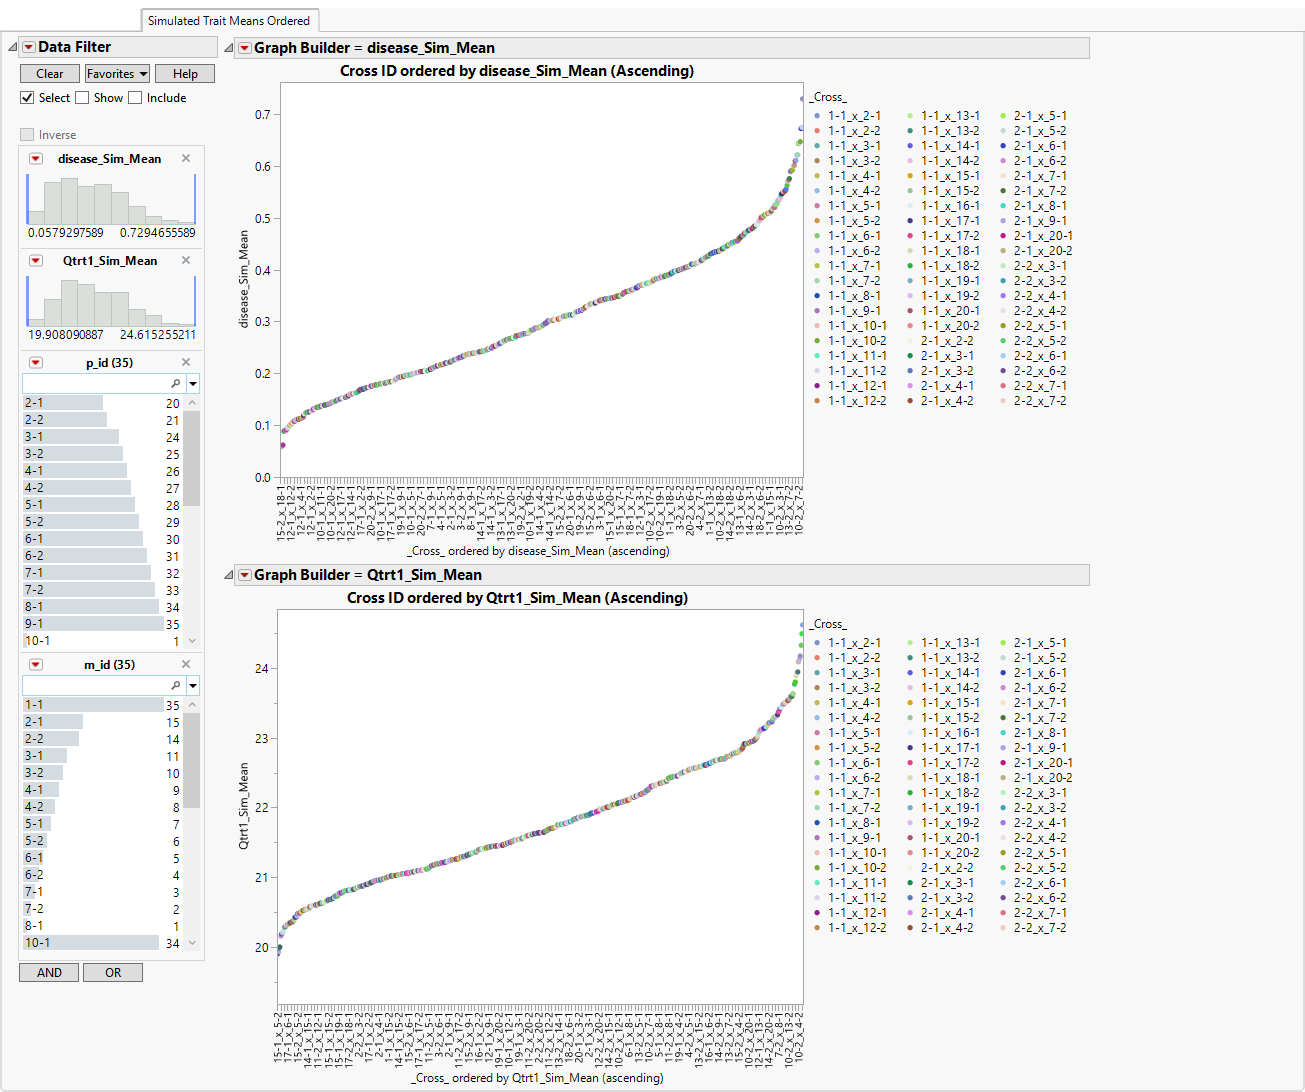
The Simulated Trait Means Ordered tab is shown below:
The Simulated Trait Means Ordered tab contains the following elements:
This element shows the average modeled traits across simulated progenies for each cross in the y-axis and their respective crosses in the x-axis. The crosses in the x-axis are ordered in ascending values from left to right according to the average of modeled trait value.