The Simulated Trait Ordered tab is shown below:
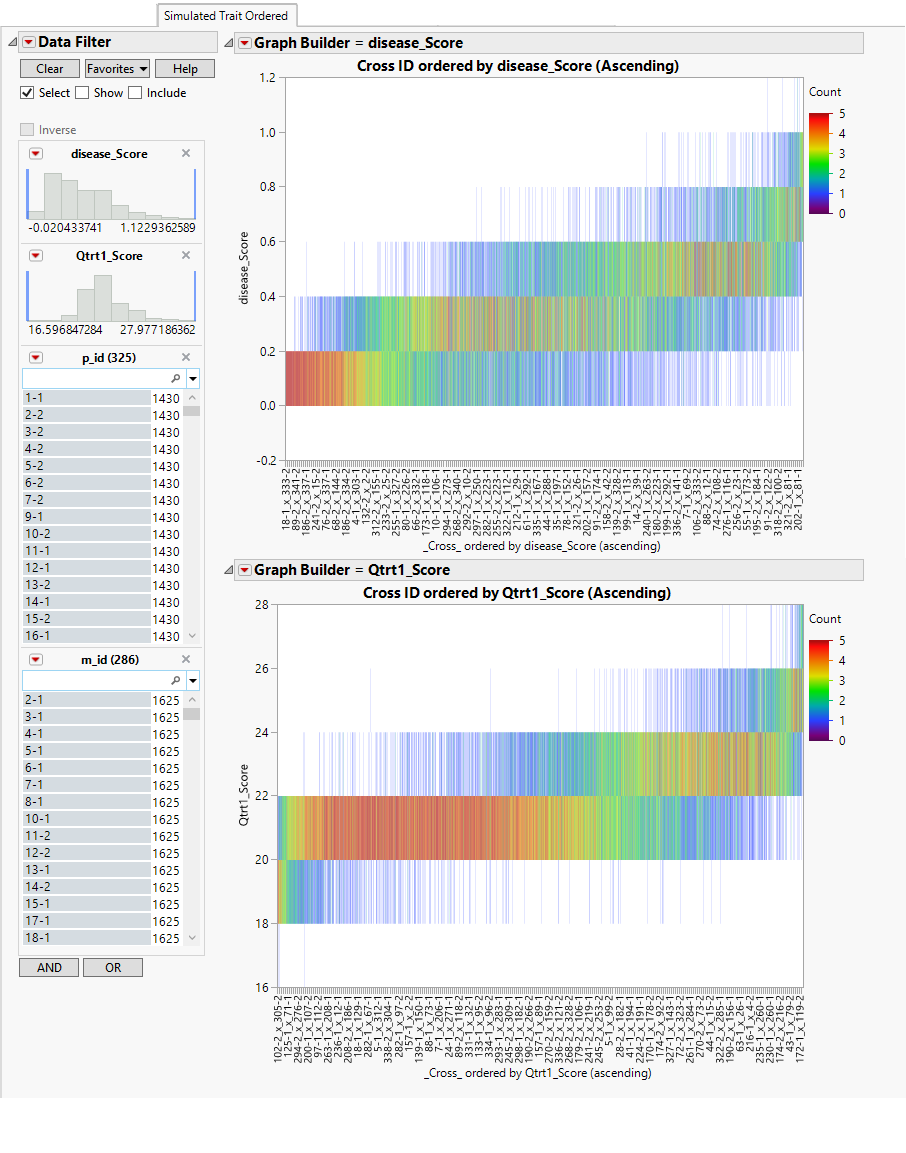
These plots (one for each trait) show the modeled traits for all simulated progenies in the y-axis and their respective crosses in the x-axis. The crosses in the x-axis are ordered in ascending values from left to right according to the modeled trait value.