The Stability tab is shown below:
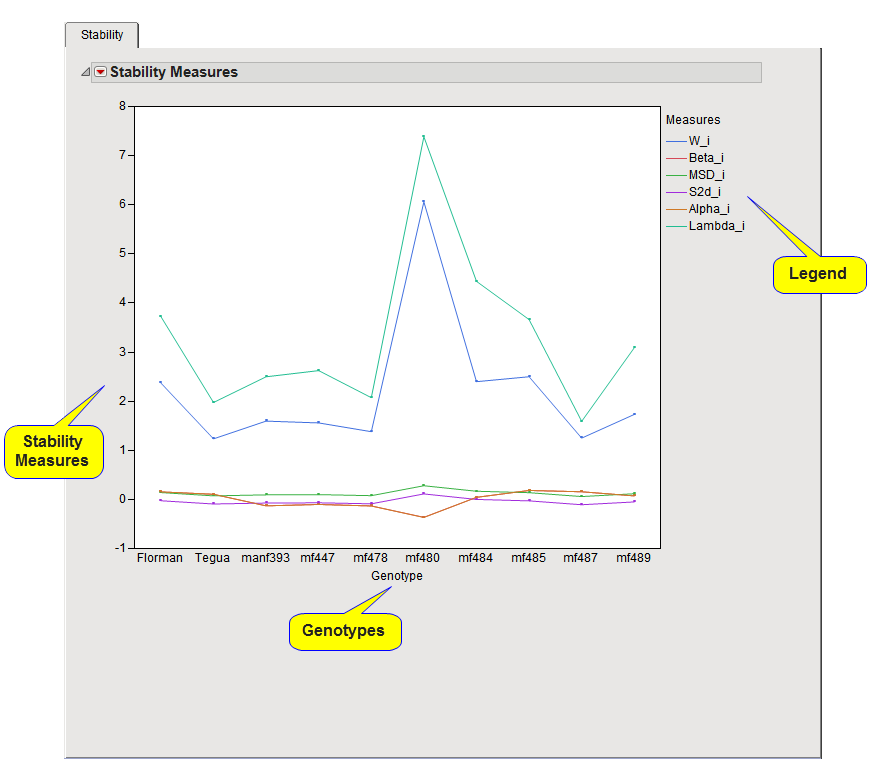
The Stability tab contains the following elements:
One Overlay Plot plot.
This plot displays various stability measures for each genotype, with the value of the stability measure represented on the y-axis. The six measures that are displayed are described in the following table:
|
|
|
|
Beta_i1
|
Regression Coefficient.
|
|
Differs from S2d_i by a constant.
|
|
|
Alpha_i2
|
|
Eberhart and Russell's measures (Betai, S2d , and MSDi) are considered together. Stable varieties occur when Betai is near 1 and S2d is near 0.
Tai’s measures (Alphai and Lambdai) are considered together. Average stability is indicated when Alphai=0 and Lambdai=1. Perfect stability is indicated when Alphai=-1 and Lambdai=1.
The Stability Point tab is shown below:
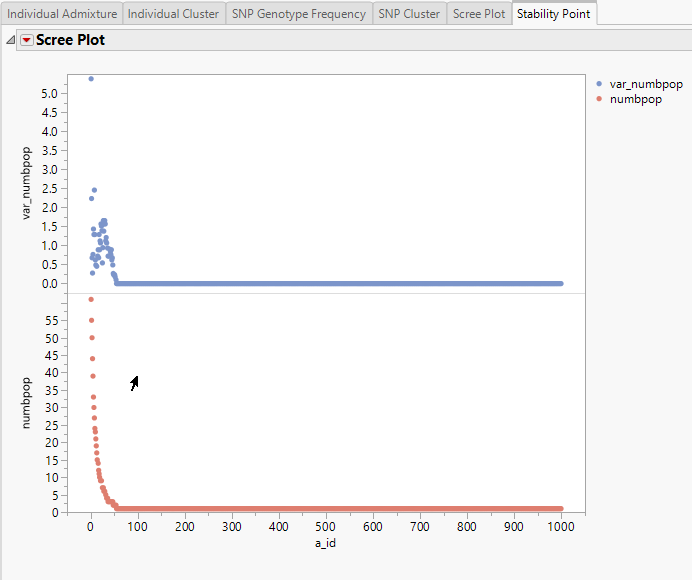
See Scree Plot for more information.