The Summary Chart tab (shown below) gives an overview of the counts of significant markers for the meta-analysis test in each group.
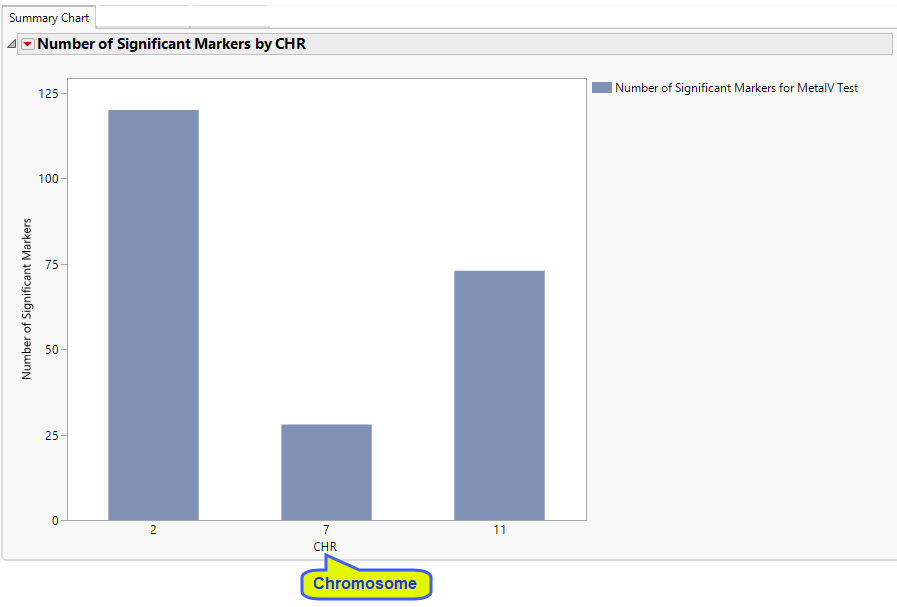
There is a separate bar for each chromosomes. This chart can be used to determine what Chromosome Results tab to open and further explore, particularly when a large number of markers were tested.