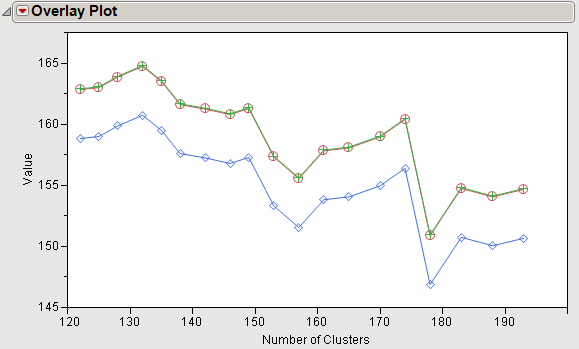
Overlay Plot This plot shows several lines or markers on the y-axis overlaid to a common variable on the x-axis. The x-axis variable can either be numeric or categorical. The y-axis variables, however, must be numeric.