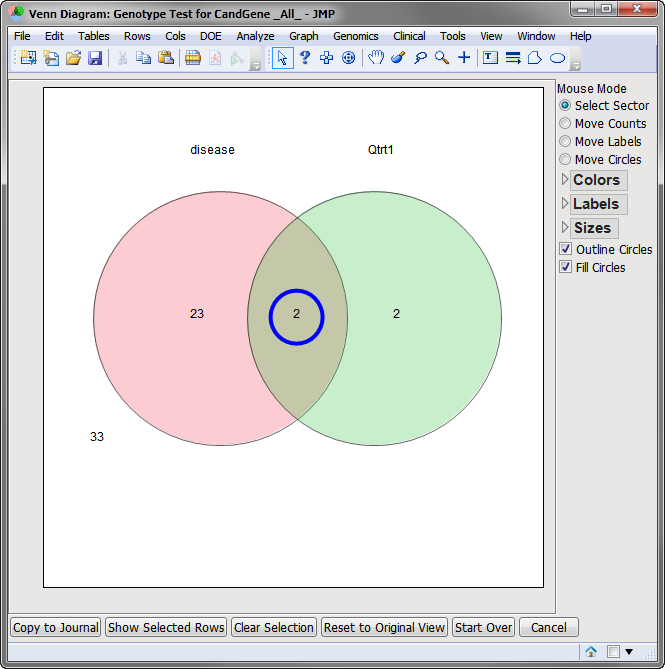
Generates a Venn diagram of markers with significant association as determined by either the Genotype or Trend association test for the traits, so you can easily identify what markers are significant for one or more traits.
Generates a Venn diagram of markers with significant association as determined by either the Genotype or Trend association test for the traits, so you can easily identify what markers are significant for one or more traits.