This tab displays distributions across all markers for the following heterogeneity statistics: Cochran's Q, the p-value for Cochran's Q, and I2 when either of the inverse variance methods for combining p-values has been selected as the Method to Use and an Effect ID Variable has been specified.
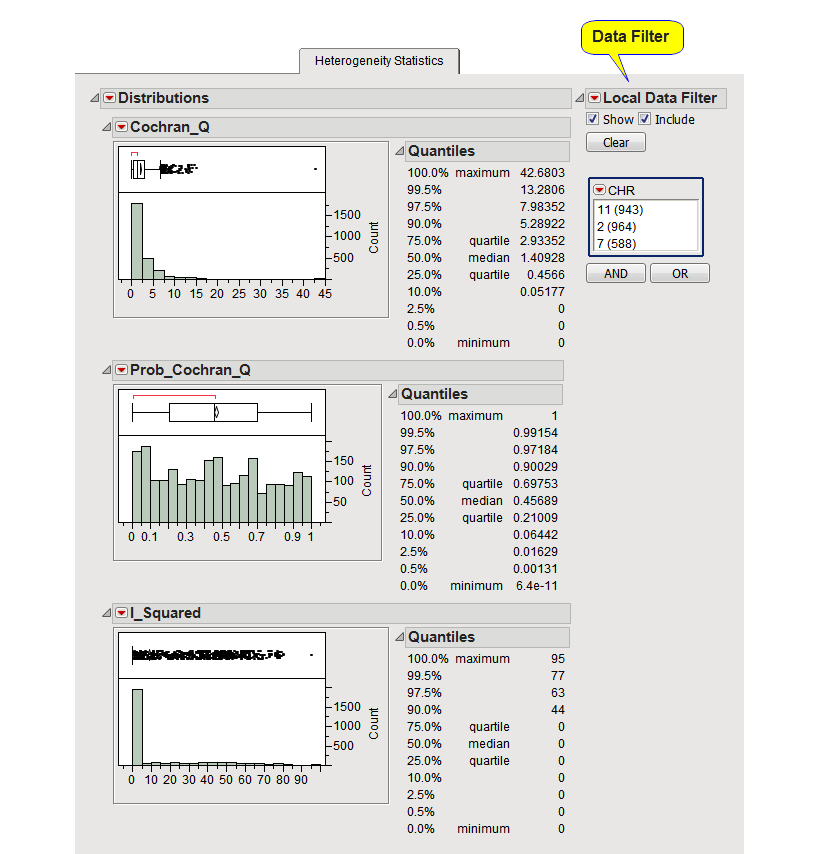
These statistics can tell you whether the fixed or random effects model is appropriate for combining p-values for a marker. Low values of Cochran's Q and I2 and a non-significant Cochran's Q p-value indicate small amounts of heterogeneity between studies and thus a fixed effects model is likely appropriate. Otherwise, a random effects model should be used.
The Local Data Filter on the right can be used to view the distributions for a single or a subset of chromosomes at a time. Note however that this does not actually select markers for the drill-down buttons. Markers can be selected either by clicking on chromosomes in the legend below the plot or by selecting points in the plot using left-click with the mouse.