The Canonical Scores tab contains the following elements:
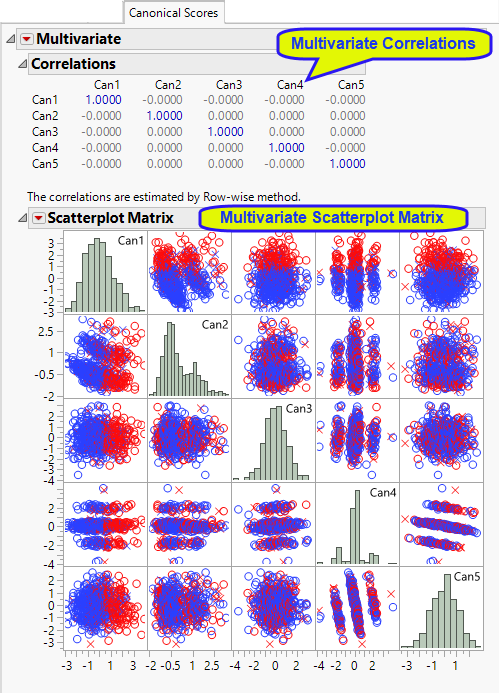
These are Pearson correlations between the canonical score variables. The correlations are typically zero.
This plots the canonical scores against each other, colored by the dependent variables. Models that predict the categorical dependent variable well exhibit clusters corresponding to the classes that are well separated.
See Scatterplot for more information.