The ROC tab contains the following elements:
|
•
|
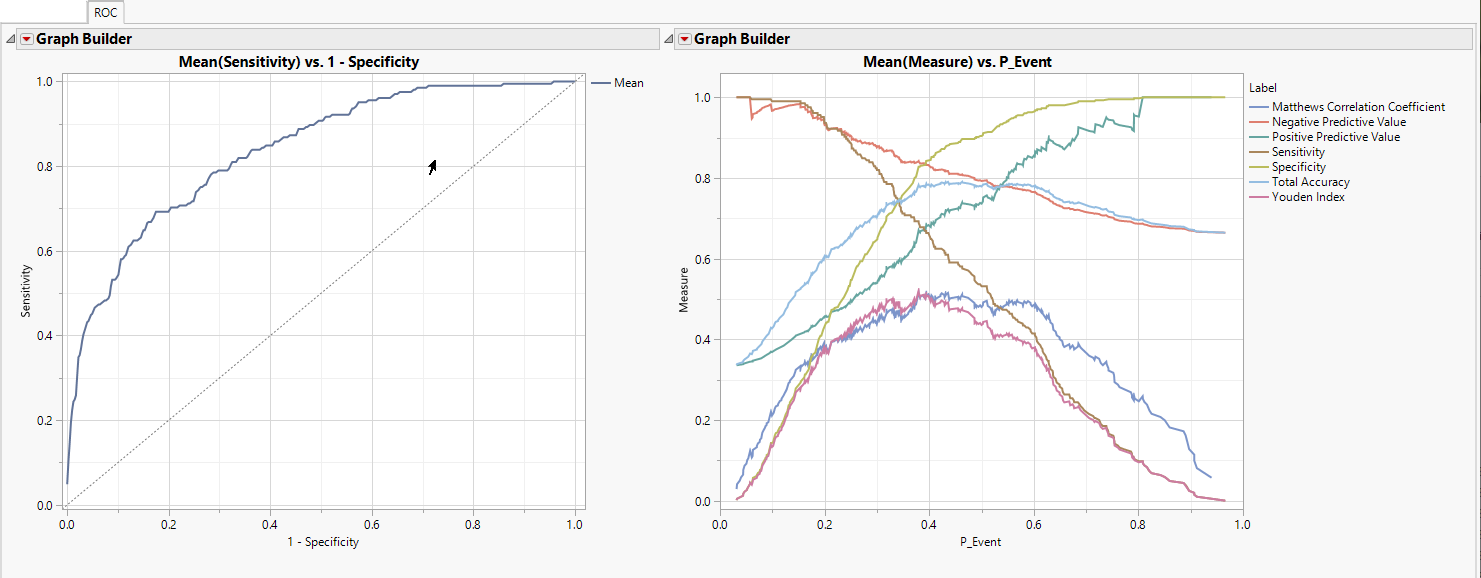
This overlay plot is the standard Receiver Operating Characteristic curve (ROC), plotting sensitivity versus 1 - specificity. The area under this curve is a measure of the sorting efficiency of the predictive model, with 1 representing perfect sorting and 0.5 random chance. Better curves come closer to the upper left corner of the plot and poor curves fall on or below the 45 degree line.
See Receiver Operating Characteristics (ROC) Curves for more information.
This overlay plot portrays several common performance statistics across all possible cutoffs of the posterior probability. Statistics include Specificity, Sensitivity, Accuracy, Positive Predictive Value, Negative Predictive Value, Matthews Correlation Coefficient, Youden Index, and Zero-One Index.
See Receiver Operating Characteristics (ROC) Curves for more information.