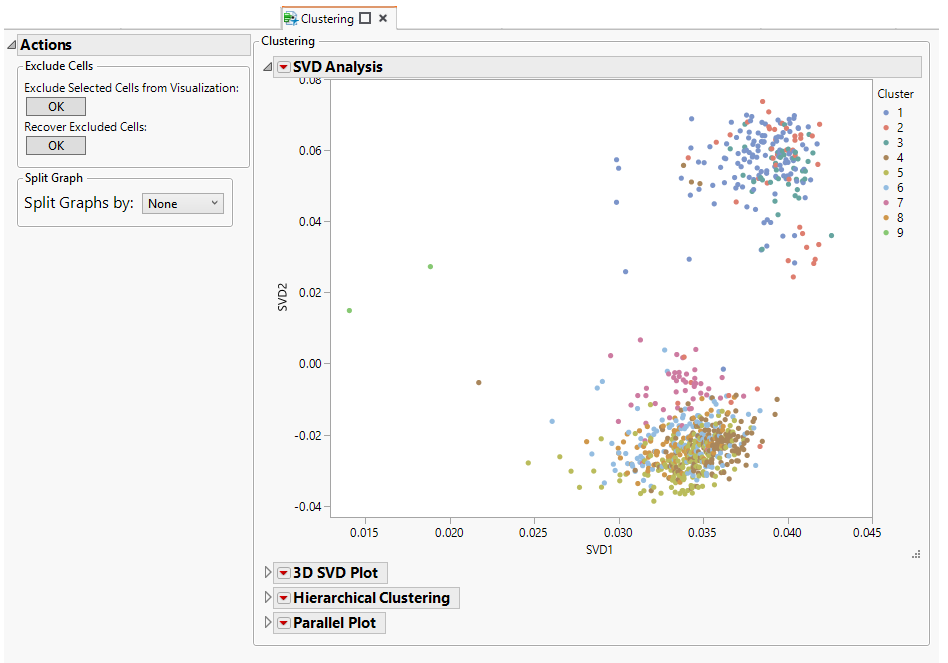
The Clustering tab is shown below:
|
•
|
One two-dimensional SVD plot
|
|
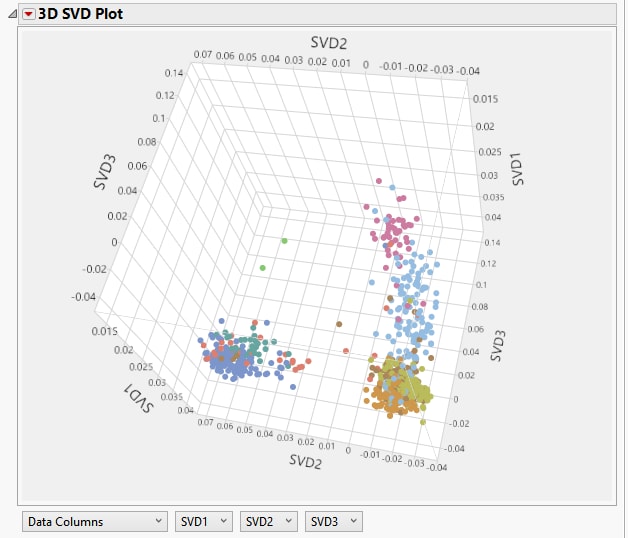
•
|
One three-dimensional SVD plot
|
|
•
|
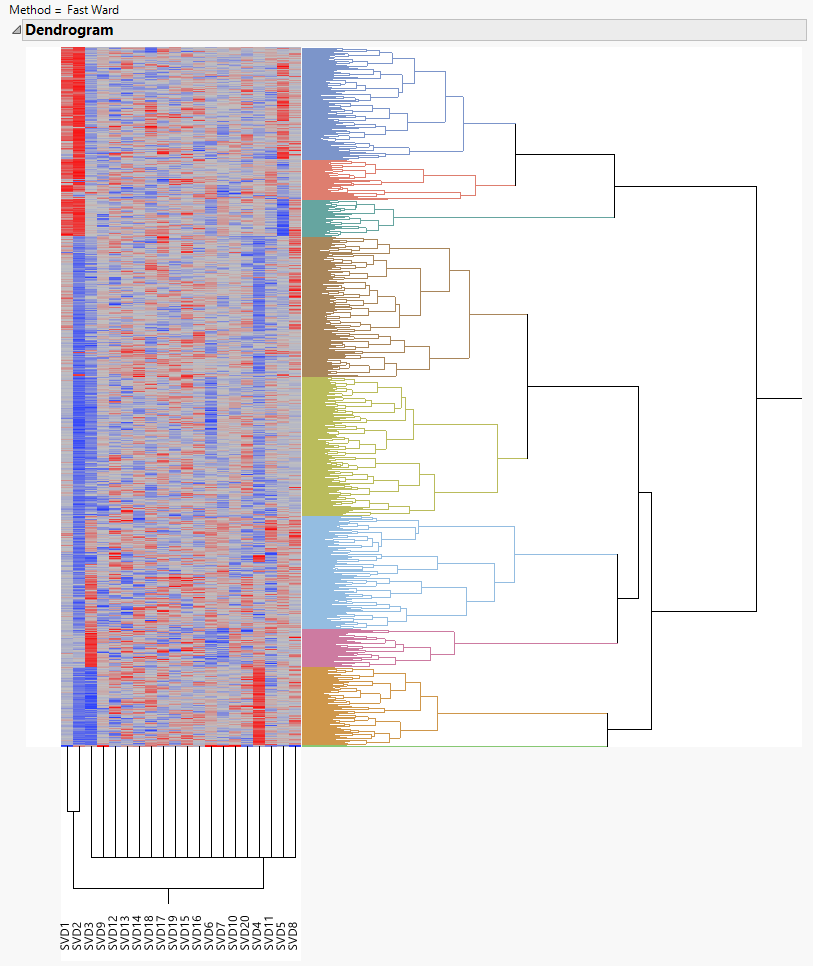
The first 20 principal components are shown on the x-axis and clusters of cells are shown on the y-axis.
|
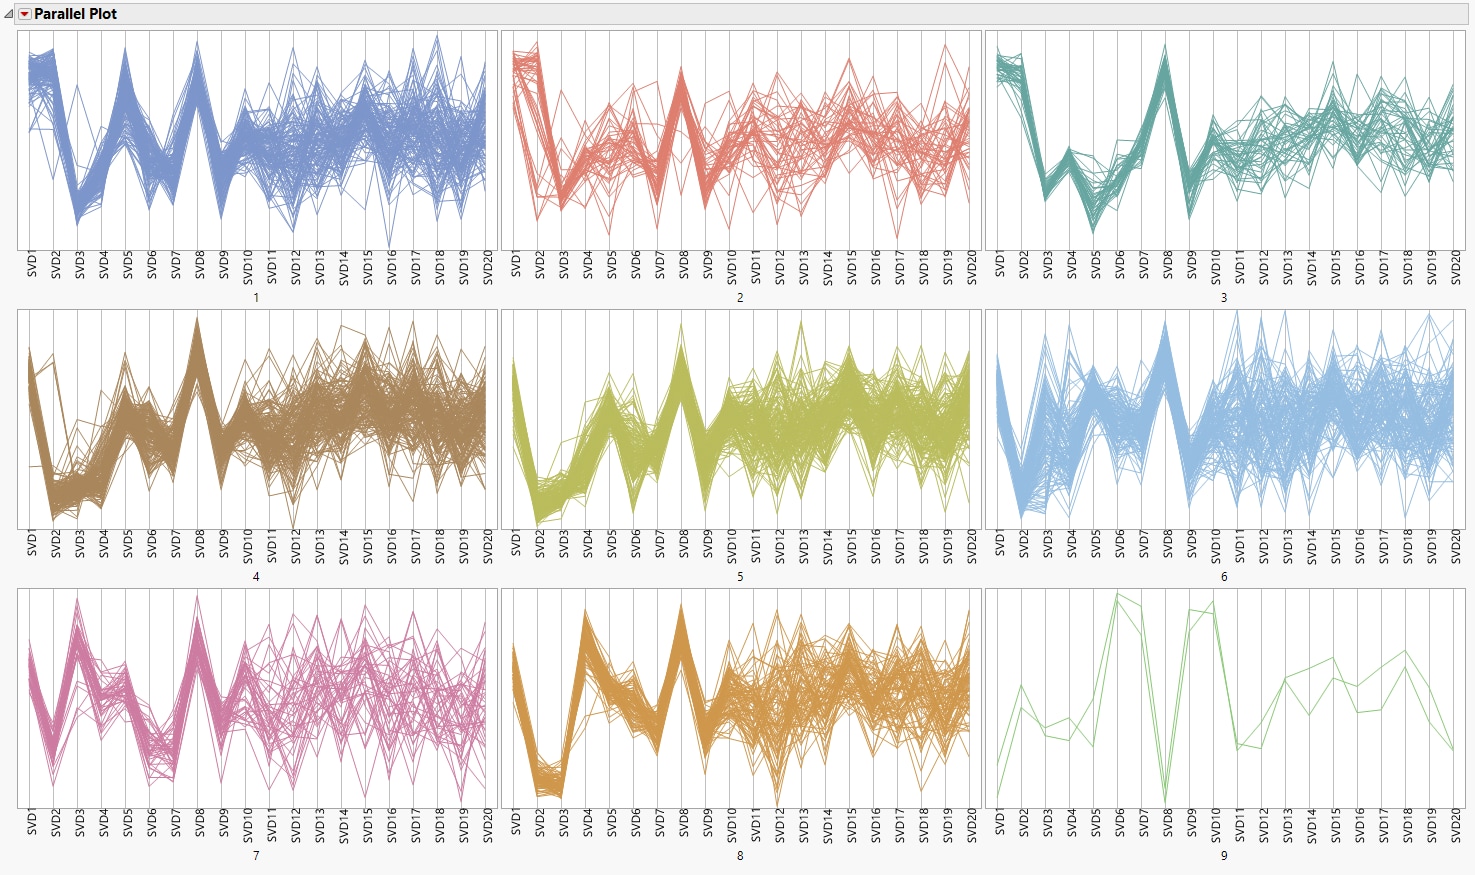
•
|