The Predictor Screening tab contains a table and accompanying bar chart, showing the contributions of the selected (red) variable genes identified on the Variable Gene Selection tab.
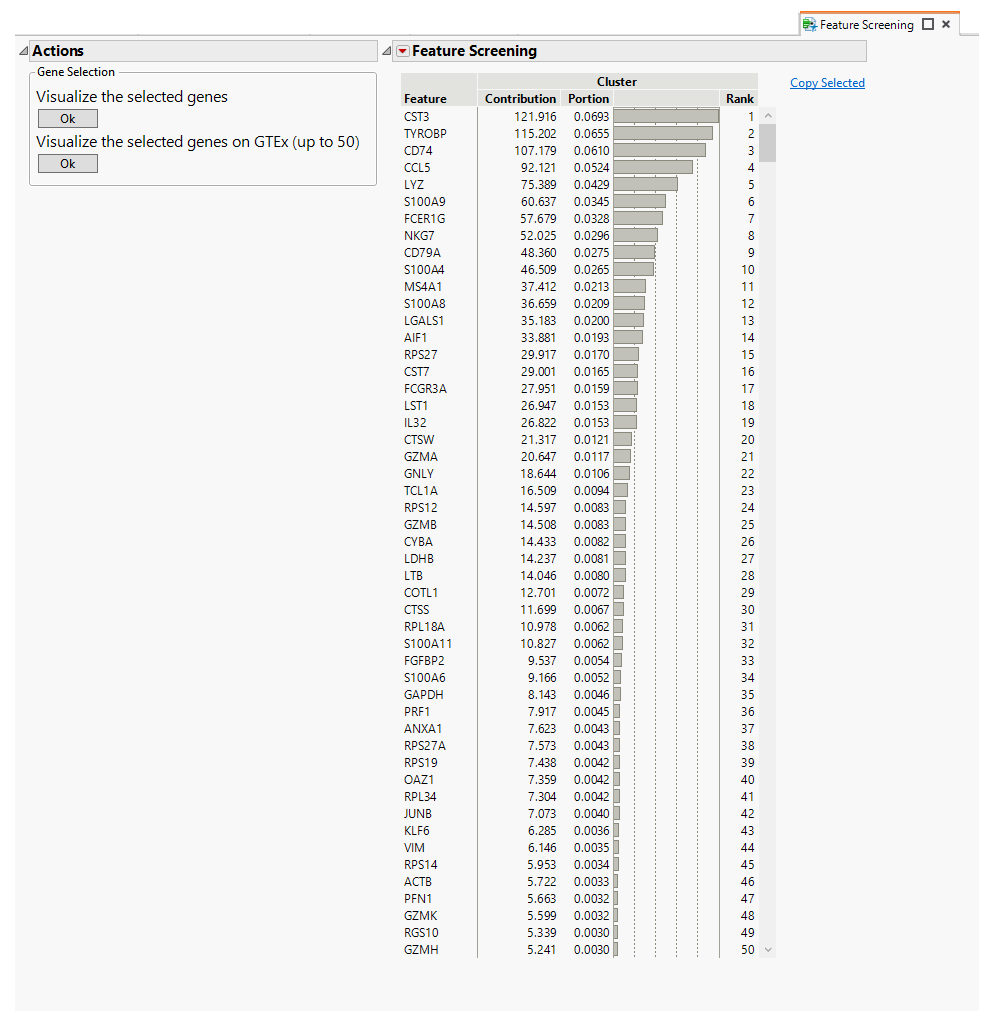
Note: This table includes over 1500 different genes. Use the scroll bar to view all selected genes.
Genes are ranked based upon their apparent importance in contributing to the variability between the clusters. However, it remains to be determined whether expression of these genes can actually be used to predict the clusters observed on the Clustering tab and, if so, which gens are most important for determining the cluster. Additional analysis is needed.
|
|
If you highlight selected genes in the plot and click to view the selected genes, the view changes to the Gene Expression Visualization tab displaying the log-transformed expression level of each selected gene across identified cell clusters.
|
|
|
You can select a subset of genes based on their importance on the table and view the selected genes on the GTEx Portal with the options on the Actions panel
|