The Variable Gene Selection section contains one variance-mean plot (below) that plots the average expression of genes across all cells verses the dispersion of the genes.
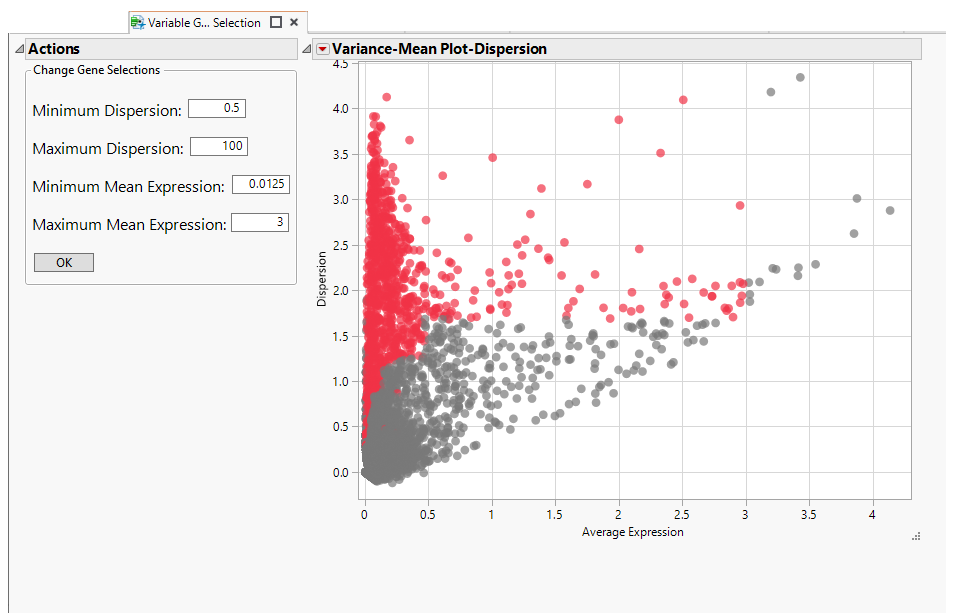
Each dot in the plot represents one gene. Red dots indicate genes that diverge and show high variability in expression from the average gene (gray), across all cells, based on the specified parameters shown in the Actions pane (expanded in this example).
You can adjust the parameters, using the options in the Actions pane, to optimize your analysis.