Output Graphics and Action Buttons
Autocorrelation Plot
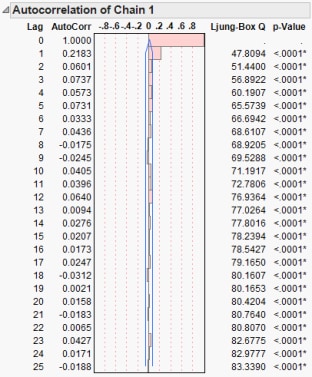
An autocorrelation plot (also referred to as a correlogram) summarizes the sample autocorrelations over time lags. It is useful in evaluating randomness in the data. Randomness is suggested by near-zero values at all time lag separations, whereas non-randomness is suggested by a significant nonzero autocorrelation for at least one time lag.
See also Time Series Graph.