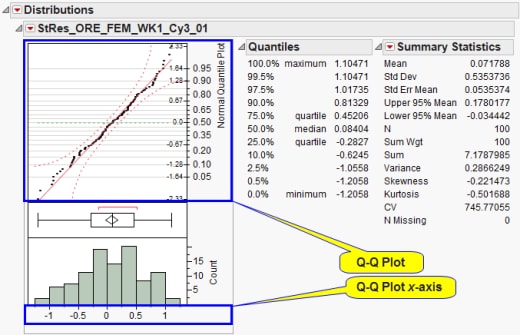
Q-Q Plot
A plot of the quantiles of two probability distributions. The inspection of Q-Q plots is a nonparametric approach to distribution comparison, serving as a graphical alternative to a numerical summary in assessing goodness-of-fit. It is often more powerful than comparing two Histograms or Scatterplots to one another.
Note the following inspection tips:
| • | An approximate line found anywhere indicates a linear relationship in the two distributions. |
| • | An approximate line found on y=x indicates similarity in the two distributions. |