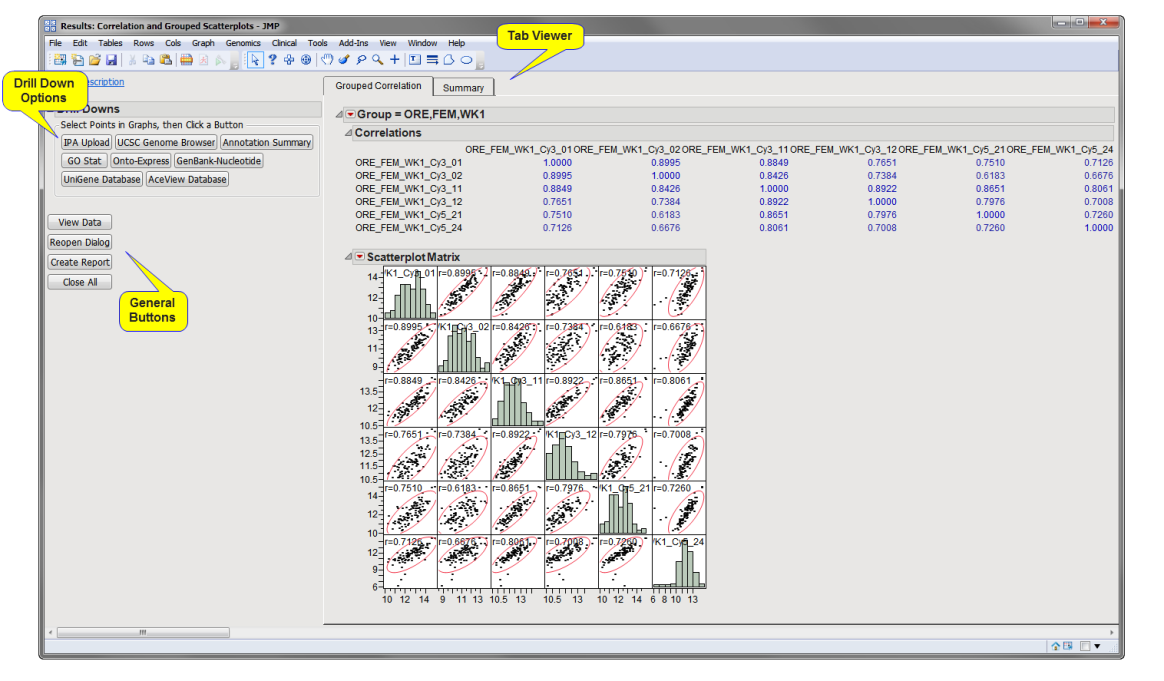
Running this process for the DrosophilaAgingExample sample setting generates the tabbed Results window shown below. Refer to the Correlation and Grouped Scatterplots process description for more information. Output from the process is organized into tabs. Each tab contains one or more plots, data panels, data filters, and so on, that facilitate your analysis.
The Results window contains the following panes:
Tab Viewer
This pane provides you with a space to view individual tabs within the Results window. Use the tabs to access and view the output plots and associated data sets.
Summary: This tab contains box plots, quantiles, and summary statistics for all experimental groups.
Drill Downs
Action buttons provide you with an easy way to drill down into your data.
The following action buttons are generated by this process:
•
IPA Upload: Select points or rows and click to open the IPA Upload process with the selected points specified as input data.
•
UCSC Genome Browser: Select points or rows and click to open the UCSC Genome Browser process with the selected points specified as input data.
•
Annotation Summary: Select points or rows and click to summarize annotation information for the selected genes or markers
•
GO Stat: Select points or rows and click to access, annotate, and analyze information for selected molecular entities in the Gene Ontology database.
•
Onto-Express: Select points or rows and click to retrieve annotation information for selected gene or markers from the Onto-Express database
•
GenBank Nucleotide: Select points or rows and click to opens a browser window directed to a GenBank Nucleotide search for the selected molecular entities.
•
UniGene Database: Select points or rows and click to open a browser window directed to a UniGene Database search for the selected molecular entities.
•
AceView Database: Select points or rows and click to access information from the ACEView database for selected genes or markers.
General
•
Click to surface the data sets corresponding to the active tab.
•
Click Reopen Dialog to reopen the completed process dialog used to generate this output.
•
Click Create Report to generate a pdf- or rtf-formatted report containing the plots and charts of selected tabs.
•
Click Close All to close all graphics windows and underlying data sets associated with the output.