Output Description
Ratio Analysis
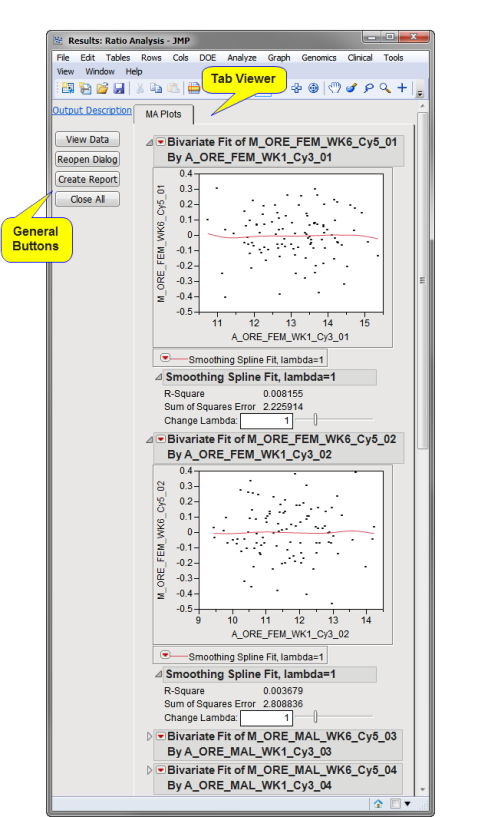
Running this process for the DrosophilaAgingExample sample setting generates the tabbed Results window shown below. Refer to the Ratio Analysis process description for more information. Output from the process is organized into tabs. Each tab contains one or more plots, data panels, data filters, and so on, that facilitate your analysis.
The Results window contains the following panes:
Tab Viewer
This pane provides you with a space to view individual tabs within the Results window. Use the tabs to access and view the output plots and associated data sets.
The following tab is generated by this process:
| • | MA Plots (Ratio Analysis): This tab shows MA plots of plots for the input data. |
General
| • | Click to surface the data sets corresponding to the active tab. |
| • | Click to reopen the completed process dialog used to generate this output. |
| • | Click Create Report to generate a pdf- or rtf-formatted report containing the plots and charts of selected tabs. |
| • | Click Close All to close all graphics windows and underlying data sets associated with the output. |