Output Description
Q-K Model Fitness
Running this process using the GeneticMarkerExample sample setting generates the tabbed Results window shown below. Refer to the Q-K Model Fitness process description for more information. Output from the process is organized into tabs. Each tab contains one or more plots, data panels, data filters, and so on. that facilitate your analysis.

The Results window contains the following panes:
Tabs
This pane enables you to access and view the output plots and associated data sets on each tab. Use the drop-down menu to view the tab in the Tab Viewer pane, open the tab in a new window, or remove the tab and its contents from the Tab Viewer pane.
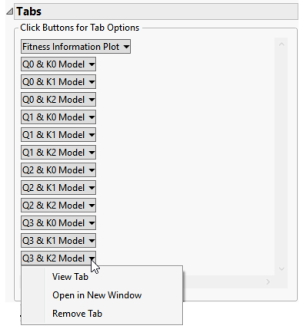
The following tabs are generated by this process:
| • | Fitness Information Plot: This tab that shows a plot of model information criteria across each model combination of Q and K matrices. |
| • | Q & K Model: Show a detailed list of parameter estimates for a specific combination of Q and K matrices. A separate tab is generated for each combination of Q and K. |
Launch Follow-up Process
| • | Q-K Mixed Model: Click to launch this process with the output data set preloaded as input. |
Tab Viewer
This pane provides you with a space to view individual tabs within the Results window.
General
| • | Click to reveal the underlying data table associated with the current tab. |
| • | Click to reopen the completed process dialog used to generate this output. |
| • | Click to generate a pdf- or rtf-formatted report containing the plots and charts of selected tabs. |
| • | Click to close all graphics windows and underlying data sets associated with the output. |